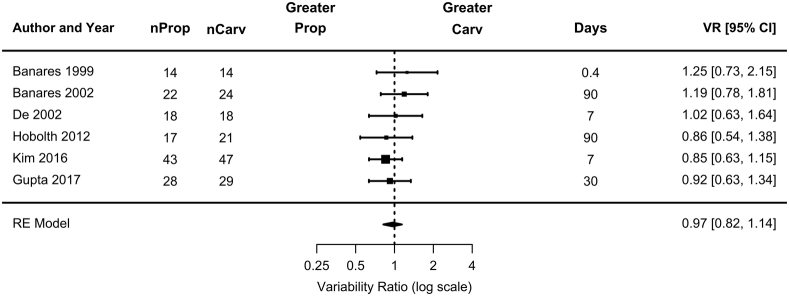
FIGURE 4.
Forest plot showing VR of the 6 studies outlined in Table 2 comparing carvedilol and propranolol. Values of VR below 1 indicate a greater variability in the final HVPG in the propranolol than in the carvedilol group. Values over 1 indicate a greater variability in the final HVPG in the carvedilol group. There was no evidence of different variabilities in the final HVPG between the groups. nProp, number of patients in the propranolol group. Abbreviation: nCarv, number of patients assessed in the carvedilol group; Days, duration of treatment; VR, variability ratio.

