. 2024 Jan 9;13:e83526. doi: 10.7554/eLife.83526

Figure 1. ARHGAP18 binds active, open ezrin through the FERM domain.

(A) Protein domain schematics of human ARHGAP18 and ezrin. (B) Western blot from pulldown experiment from passing WT-Jeg3 placental epithelial cell lysate over an anti-flag resin then blotting against flag-tagged ezrin and endogenous ARHGAP18. Ezrin tagged internally (iflag) within a flexible linker region at residue 479. (C) Western blot of ARHGAP18-bound resin pulldown experiment blotting against ezrin constructs expressed in WT-Jeg3 cells. (D) Western blot of ARHGAP18-bound resin pulldown experiment blotting against ezrin-constructs expressed in LOK-/-SLK-/--Jeg3 cells. (E) Quantification of normalized band intensity from all experiment presented in (C, D). Bars represents mean ± SEM; n = 4. Aggregated WT and LOK-/-SLK-/- conditions as populations were compared using a ratio paired t-test and found to be significantly different (p=0.0235).

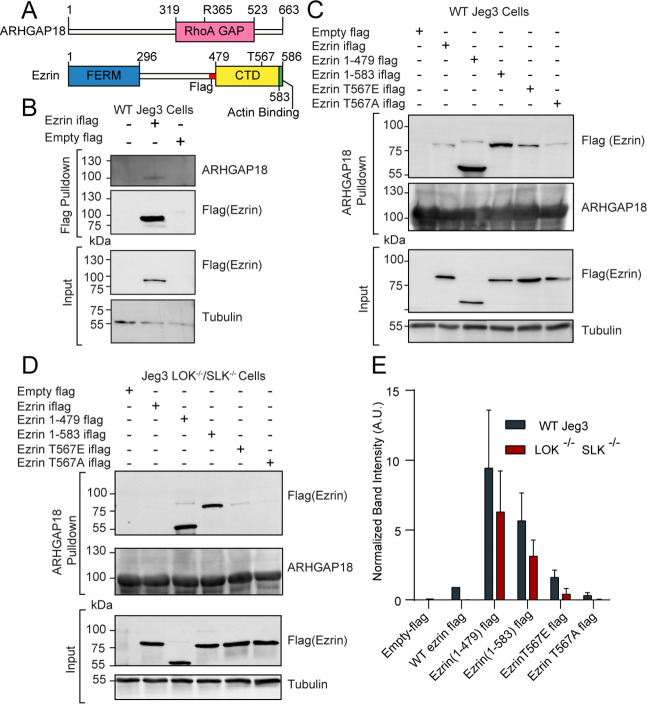
Figure 1—source data 1. Full western blot images from all blots shown in Figure 1.

Figure 1.

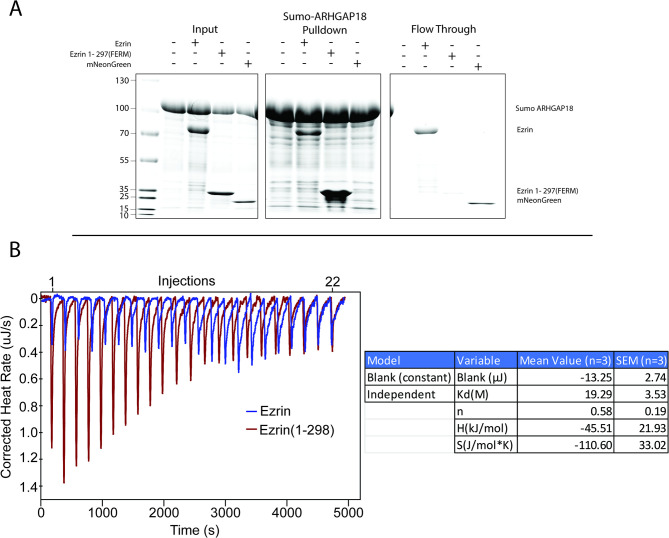
Figure 1—figure supplement 1. ARHGAP18 affinity for ezrin using purified proteins.

Figure 1—figure supplement 1.

(A) Coomassie stained gels from assay testing the binding of full-length ezrin, ezrin-FERM (1–297), and mNeonGreen (negative control) to a resin saturated with SUMO-ARHGAP18. From left to right: input proteins, pulled-down proteins, flowthrough proteins. Both FL-ezrin and mNeon green are observed in the flowthrough while FERM is only found bound to the column. FL-ezrin shows weaker affinity for the column than FERM, whereas mNeonGreen did not bind the SUMO-ARHGAP18 column. (B) Representative injections (above) and plotting of area under each injection peak with fit (below). FL-WT ezrin did not show measurable binding to ARHGAP18 while FERM produced measurable binding curves. Reported Kd is (mean ± SEM) from replicates of individual isothermal calorimetry (ITC) experiments.
Figure 1—figure supplement 1—source data 1. Full western blot images from all blots shown in Figure 1—figure supplement 1.

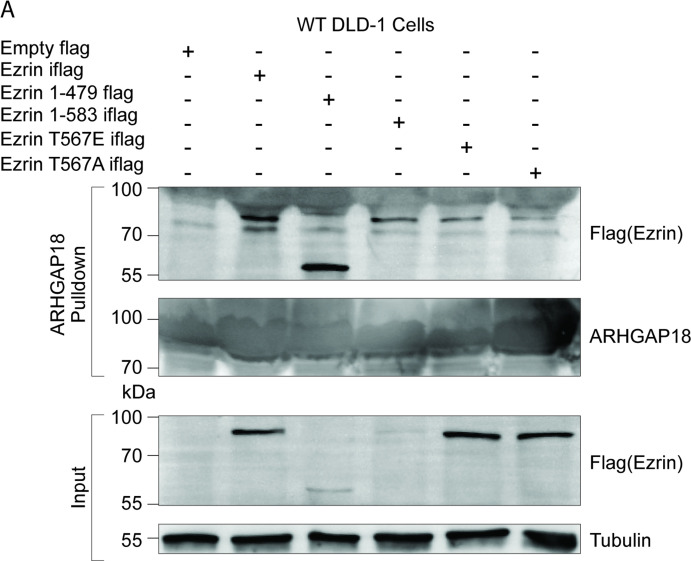
Figure 1—figure supplement 2. ARHGAP18 binds active, open ezrin through the FERM domain in DLD-1 cells.

Figure 1—figure supplement 2.

(A) Western blot replication of experiment in Figure 1C except done in DLD-1 human colorectal cells instead of placental Jeg3 cells. Expression of constitutively active forms of ezrin and FERM is detrimental to many cell types leading to lower expression. Even with much reduced expression, comparison of input to pulldown shows a preferential binding of FERM to ARHGAP18 compared to WT ezrin.
Figure 1—figure supplement 2—source data 1. Full western blot images from all blots shown in Figure 1—figure supplement 2.