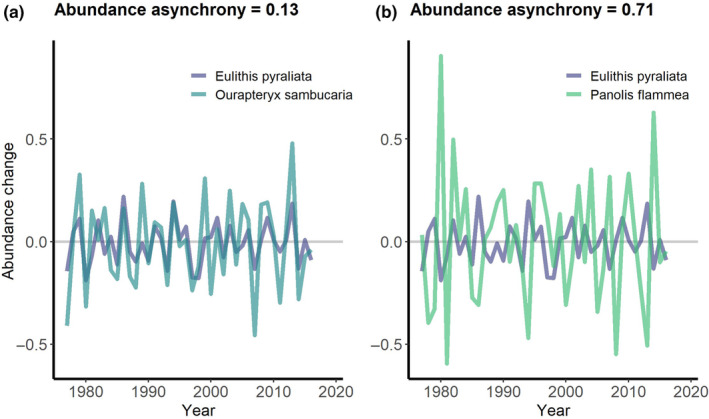
FIGURE 1.

Examples of different levels of asynchrony between interannual abundance dynamics of two pairs of macro‐moth species; (a) Eulithis pyraliata (barred straw moth) and Ourapteryx sambucaria (swallow‐tailed moth); and (b) E. pyraliata and Panos flammea (pine beauty moth). In example (a), the high correlation between the species interannual abundance change values results in a calculated abundance asynchrony value of 0.13 (where asynchrony lies between 0 and 1, with 0 being completely synchronous and 1 being completely asynchronous); in example (b), the two species cycle more asynchronously in abundance, with lower correlation between their abundance dynamics, resulting in a calculated asynchrony value which is closer to 1 (0.71).
