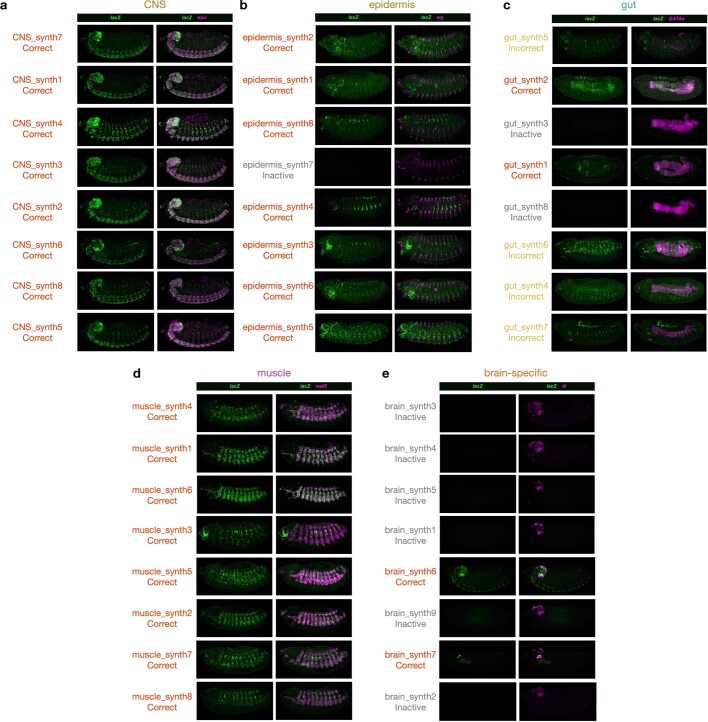
Extended Data Fig. 9. All synthetic sequences experimentally tested as enhancers.
A-E) Left panels show the lacZ intensity (green) as a marker for the enhancer activity pattern of the respective candidate sequence (labeled on the left). Right panels show the intensity of both the lacZ reporter gene driven by the synthetic sequence (green) and the corresponding endogenous marker gene (pink) for the respective tissue (elav (CNS), wg (epidermis), GATAe (gut), Mef2 (muscle) and tll (brain)). Synthetic enhancers are labeled as correct tissue expression, incorrect tissue expression and inactive. For each sequence, one representative embryo is shown from the total 200–300 double FISH-stained embryos. Scale bar, 100 μm. See Table S2 for more details.

