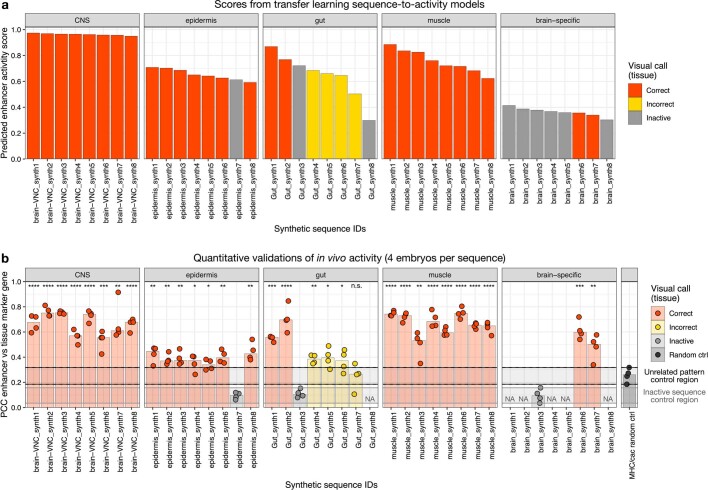
Extended Data Fig. 10. Predicted scores for synthetic sequences and quantitative validations.
a) Predicted enhancer activity scores by the sequence-to-activity transfer learning models for candidate synthetic enhancers per tissue. Sequences are colored based on their validated in vivo activity: correct tissue expression, incorrect tissue expression and inactive. b) Quantitative validations for each candidate synthetic sequence per tissue. Pixel-wise Pearson Correlation Coefficient (PCC) between the marker genes and the synthetic enhancers calculated across the entire embryo volume are shown for 4 embryos per sequence (dots). Barplots represent the respective median value across the 4 embryos. For epidermis, gut, and brain, the PCCs between the marker genes and one inactive candidate per tissue (grey) are displayed. NA: PCCs not quantified for these inactive candidates. As an additional control, PCCs between two unrelated genes are shown (black; see Methods). Sequences are colored based on their validated in vivo activity: correct tissue expression, incorrect tissue expression and inactive. Same order of sequences as in (A). P-values from two-sided t-test between the PCCs of each sequence and the PCCs of two unrelated genes are shown for each sequence: **** p-value < 0.0001, *** <0.001, ** <0.01, * <0.05, n.s. non-significant. The two rectangles represent the interval of PCC values (between minimum and maximum) for the inactive (grey) and unrelated pattern (black) control sequences.

