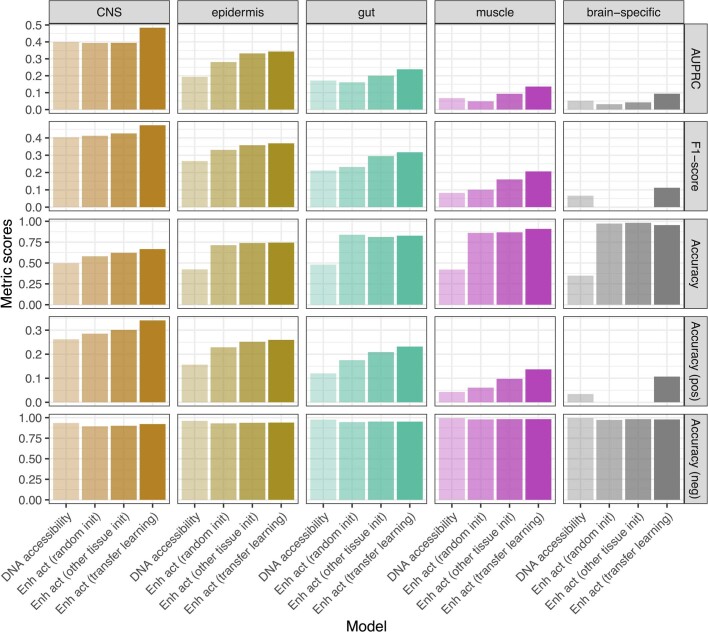
Extended Data Fig. 4. Metric evaluation of the different models.
The performance of different models (x-axis) per tissue (column) was evaluated on test data with five different metrics: area under the precision-recall curve (AUPRC), F1-score, accuracy across all sequences, only among positive, or only among negative sequences. The models are the ones from Extended Data Fig. 3: the sequence-to-accessibility (DNA accessibility) and sequence-to-activity (transfer learning) models, plus control models trained directly on the in vivo enhancer activity data starting from random initialization or pre-trained on ATAC-seq data from an unrelated tissue.

