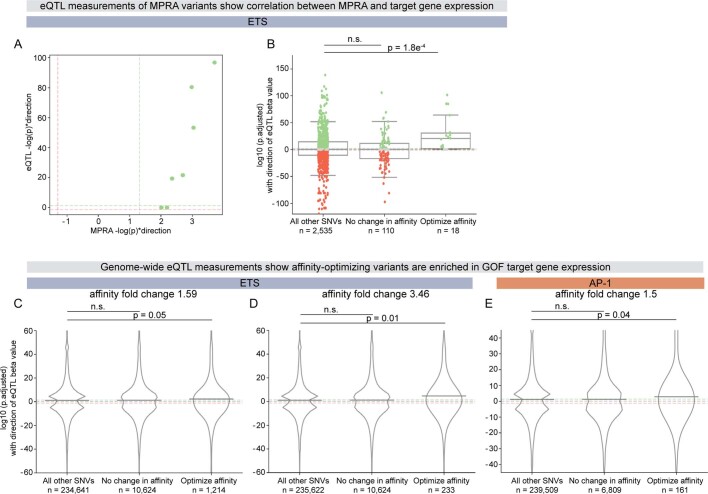
Extended Data Fig. 10. Affinity-optimizing eQTL variants are enriched in GOF target gene expression.
a, Seven ETS affinity-optimizing variants within lymphoblastoid regulatory element MPRA drive significant GOF reporter expression40. Five of these are associated with significant eQTL differential expression and all of these SNVs drive increased target gene expression41. Dotted lines indicate thresholds for significance at P < 0.05 (significant GOF in green, and significant LOF in red). b, eQTL analysis for all MPRA variants tested within the lymphoblastoid regulatory elements (regardless of variant effect within MPRA assay)40,41. ETS affinity-optimizing SNVs are enriched in GOF target gene expression. The bounds of the box plots define the 25th, 50th and 75th percentiles, and whiskers are 1.5 × the interquartile range. One-tailed Mann–Whitney U test. c–e, Genome-wide analyses for all significant eQTLs (P < 0.01) within the lymphoblastoid cell line41 show that affinity-optimizing variants are enriched for GOF expression. Line indicates mean values. One-tailed Mann–Whitney U Test. c, ETS SNVs with ≥1.59 affinity fold change. d, ETS SNVs with ≥3.46 affinity fold change; this is the fold change of 0.52 mice relative to WT 0.15 ETS-A. e, AP-1 SNVs ≥1.5 affinity fold change.

