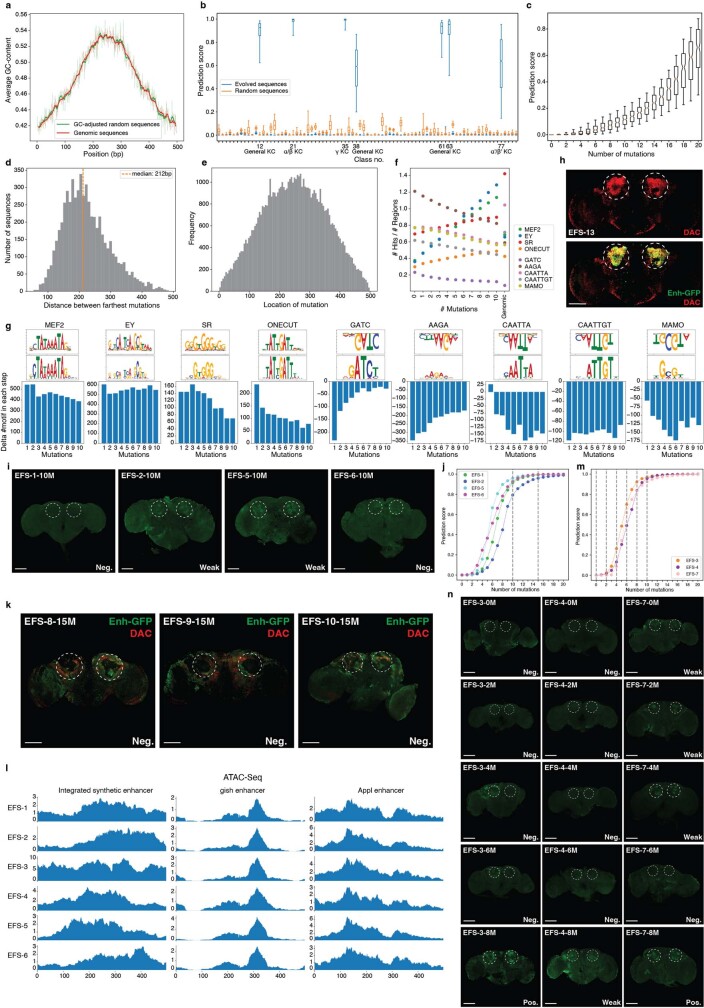
Extended Data Fig. 1. In silico sequence evolution from random sequences.
a, Distribution of GC content in GC-adjusted random sequences (green) and fly genomic regions (red). b, Prediction score distribution of the sequences (n = 6,000 sequences) for all classes after 10 mutations. The KC-specific classes and their class number are indicated. In b,c, the box plots show the median (centre line), interquartile range (box limits) and 5th and 95th percentile range (whiskers). c, Prediction score distribution of the sequences that do not reach 0.5 prediction score threshold after 15 mutations for the γ-KC class (n = 180 sequences) after each mutation. d, Distribution of distances (n = 6,000) between farthest mutations on each sequence after 10 iterative mutations. The orange line shows the median. e, Location of the generated mutations across the random sequences (n = 6,000 sequences). f, Average number of motif hits at each mutational step compared to genomic enhancers. g, Delta number of motifs in each mutational step. The TF-Modisco patterns and the most similar position weight matrices from the cisTarget motif database are shown at the top of each plot. The patterns that are upside-down are the ones contributing negatively to the model’s prediction and they are destroyed by the model on each step. h, Top: Dachshund staining (red) highlights KC location in the fly brain. Bottom: colocation of the Dachshund (red) and GFP (green) staining from enhancer EFS-13. i, In vivo enhancer activity of the cloned sequences with no or weak enhancer activity. j, Prediction scores, at each mutational step, of 4 sequences with no enhancer activity after 10 mutations. The selected iterations (10th and 15th mutations) are indicated with a dashed line. k, Dachshund (red) and GFP (green) staining for three negative enhancers. l, Drosophila adult brain bulk-ATAC-seq profile of 6 transgenic flies that have the designed enhancers integrated. The chromatin accessibility profile of the integrated enhancers (left) and two control regions gish enhancer (middle) and Appl enhancer (right) are shown. m, Prediction scores, at each mutational step, of 3 EFS sequences. The selected iterations to study intermediate mutational steps (0, 2, 4, 6, 8, 10 mutations) are indicated with a dashed line. n, In vivo enhancer activity of fly lines with subsequent mutational steps. After 8 mutations of a random sequence, the enhancer becomes active in all three lines (EFS-3, 4 and 7) marked by GFP expression. In panels h,i,k,n, the expected location of γ-KC is shown with dashed circles. Scale bars, 100 µm.

