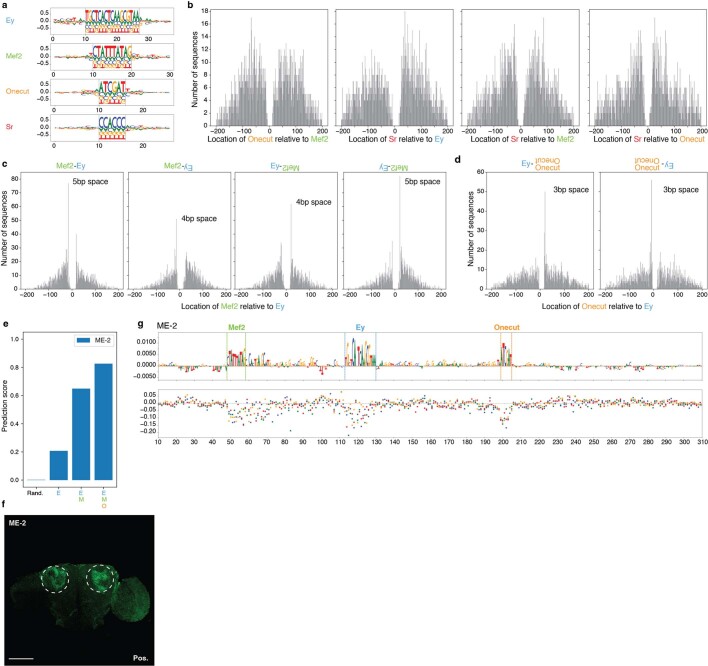
Extended Data Fig. 4. Enhancer design by motif implanting.
a, Preferred nucleotides flanking implanted motifs (n = 2,000). Dashed lines, motifs boundaries. b, Distribution of Onecut locations relative to Mef2, Sr to Ey, Sr to Mef2 and Sr to Onecut, respectively (n = 2,000). c, Distribution of Mef2 locations relative to Ey when both are on the same strand, Ey is on the negative strand, Mef2 is on the negative strand and both are on the negative strand, respectively (n = 2,000). d, Distribution of Onecut locations relative to Ey when Ey is on the positive strand and when Ey is on the negative strand, respectively (n = 2,000). e, DeepFlyBrain KC prediction score of the ME-2 sequence after consecutive motif implanting. f, In vivo enhancer activity of ME-2 enhancer. The expected location of KC is shown with dashed circles. Scale bar, 100 µm. g, Nucleotide contribution scores of the ME-2 motif implanting sequence (top) and in silico saturation mutagenesis assays (bottom). Each dot on the saturation mutagenesis plot represents a single mutation and its effect on the prediction score (y axis).

