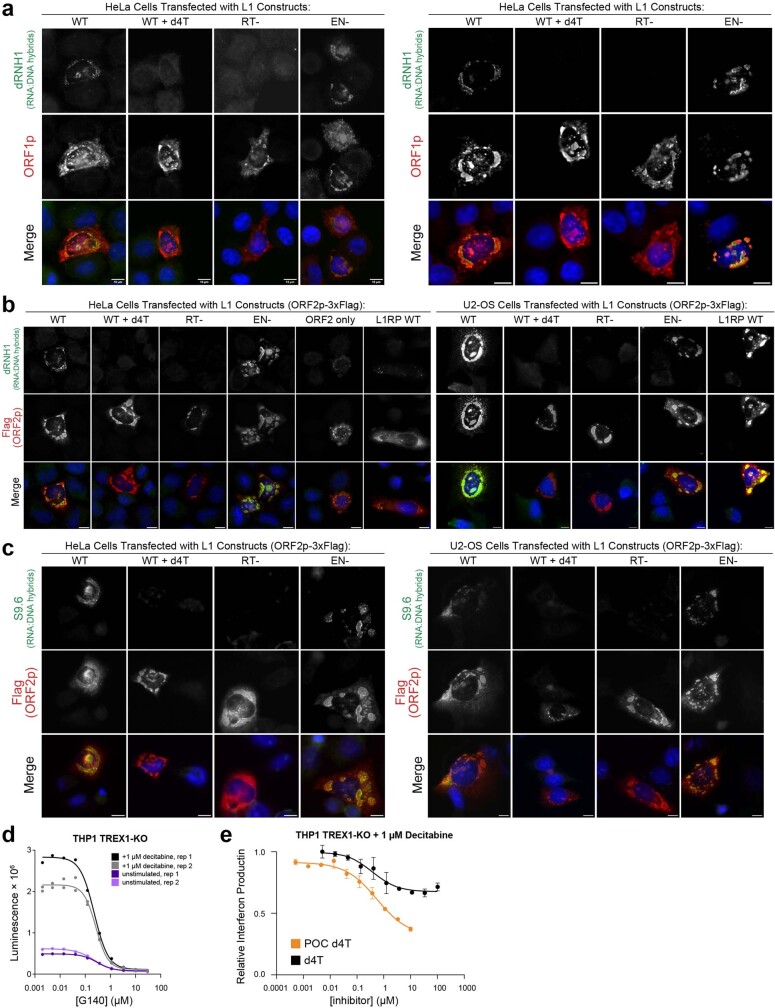
Extended Data Fig. 6. Cytoplasmic RT activity of ORF2p and activation of interferon.
a-c Indirect immunofluorescence of cells transiently transfected with plasmids expressing the indicated L1 constructs and stained for RNA-DNA hybrids and ORF2p or ORF1p using two different hybrid detection reagents demonstrates cytosolic synthesis. Constructs all include C-terminal 3C-3xFlag tag on ORF2p and are synthetic ORFeus-Hs63 sequence except where L1RP is indicated (L1 retinitis pigmentosa locus, AF148856, pLD56417). Cells were fixed in methanol and stained 24 h post transfection with the indicated constructs. Images are representative from 4 independent experiments. D4T RTI treatment is 50 µM, added at the time of transfection. RT- is L1 with D702Y mutant ORF2, EN- is L1 with double E43S + D145N mutant ORF2. a, ORF1p co-stain in HeLa cells with dRNH1 (catalytically inactive human Rnase H1 fused to GFP64). b, ORF2p (Flag) with dRNH1 co-stain in HeLa and U2-OS cells. c, ORF2p (Flag) with S9.6 co-stain in HeLa and U2-OS cells. d, Inhibition of interferon signaling in THP1 cells with cGAS inhibitor G140, with and without decitabine treatment; raw luciferase data are shown, n = 4 biologically independent samples from two independent experiments; all points shown. IC50s for G140 are 0.23-0.30 µM. e, Relative interferon production from titrations of d4T vs POC d4T prodrug [d4T bis(isopropoxycarbonyloxymethyl)phosphate] in TREX1 knockout THP1 cells treated for 5 days with 1 µM decitabine plus the indicated concentration of drug; normalized luciferase data from n = 4 biologically independent samples representative of two independent experiments; error bars are mean ± SD.

