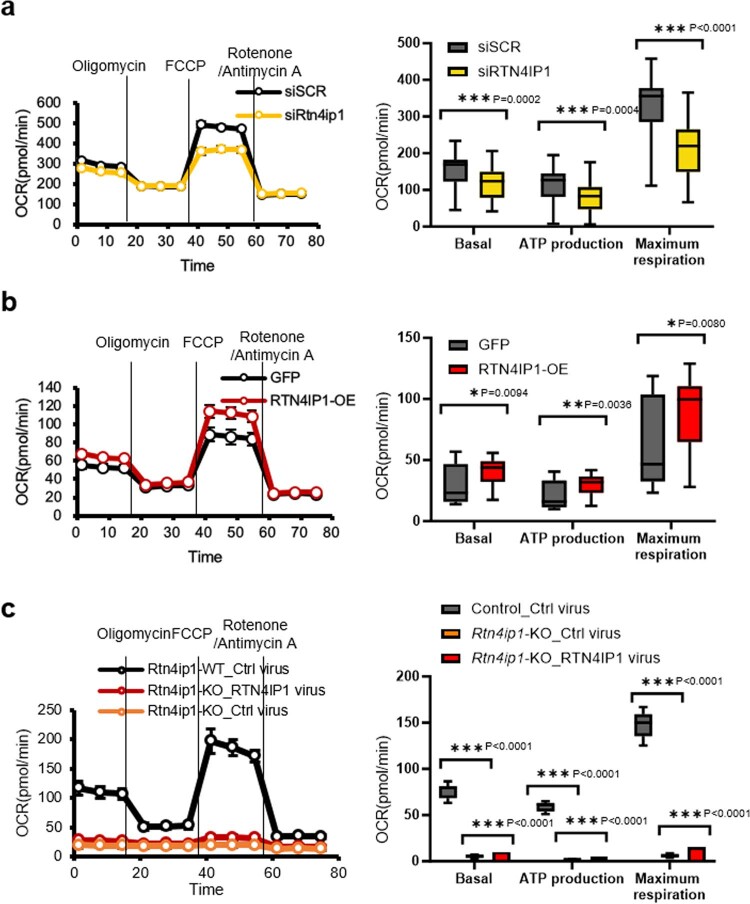
Extended Data Fig. 8. Oxygen consumption rate (OCR) and OXPHOS complex expression levels in RTN4IP1-KD C2C12 and RTN4IP1-overexpressed (RTN4IP1-OE) C2C12 cells.
(a) Measurement of oxygen consumption rate (OCR), basal respiration, maximal respiration, and ATP production in control (siSCR) and Rtn4ip1 knockdown C2C12 cells (siRtn4ip1). (n = 46 biological replicates) (b) Oxygen consumption rate (OCR) and basal respiration, ATP production, and maximal respiration of RTN4IP1-overexpressed (RTN4IP1-OE) C2C12 cells. GFP-overexpressed cells were used as a control. (n = 30 biological replicates) (c) Oxygen consumption rate (OCR) and basal respiration, ATP production, and maximal respiration of RTN4IP1-rescued C2C12 cells. GFP-overexpressed cells were used as a control. (n = 30 biological replicates) Mean values are shown with error bars representing the standard deviation. Statistical significance was determined using a two-tailed Student’s t-test: *p < 0.05, **p < 0.01, ***p < 0.001. Source data can be found in the Source Data file.

