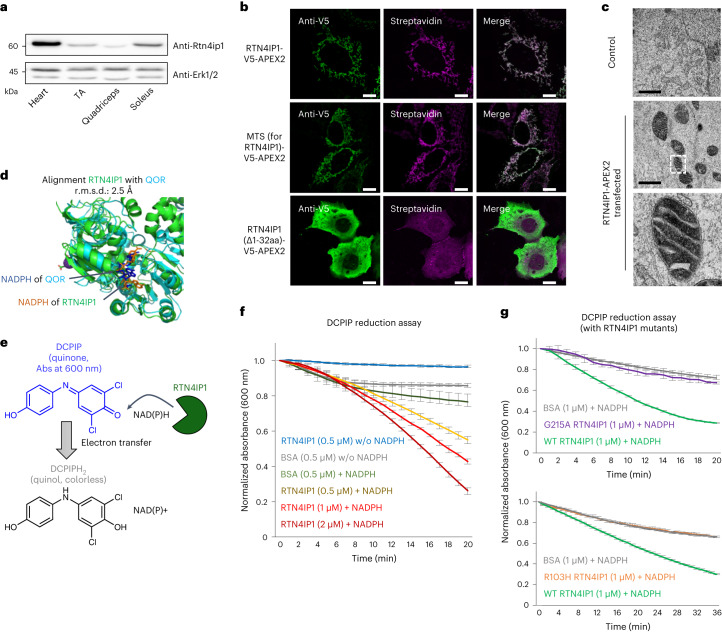
Fig. 3. RTN4IP1 is localized at the mitochondrial matrix and displays NAD(P)H oxidoreductase activity.
a, Western blotting of RTN4IP1 in the heart and three types of skeletal muscle. Anti-ERK1/2 was used as a loading control. Representative images from three independent experiments are shown. b, Confocal microscopy imaging of mitochondrial biotinylation by RTN4IP1-V5-APEX2 in HEK293T cells (anti-V5 imaging with the GFP channel, streptavidin imaging with the Cy5 channel). The N-terminal MTS (~R32) of RTN4IP1 was predicted by MitoFates. Scale bars, 10 µm. c, TEM images of RTN4IP1-APEX2-transfected HEK293T cells (right) and nontransfected HEK293T cells (left). Scale bars, 1 μm. Both samples were treated with DAB and H2O2, followed by OsO4 staining. Mitochondrial matrix DAB/OsO4 staining of RTN4IP1-APEX2 is highlighted in the magnified images of the white boxed region. d, Comparison of the crystal structure between RTN4IP1 and quinone NADPH oxidoreductase (QOR) (PDB ID 1QOR, blue). The molecular structure of cocrystalized NADPH is shown in the structure of RTN4IP1 and QOR. r.m.s.d., root mean-squared deviation. e, Scheme for the DCPIP assay of the QOR activity of RTN4IP1. f, Real-time monitoring results using blue-colored oxidized DCPIP as the quinone substrate (n = 3 independent experiments). DCPIP turns colorless when it accepts an electron from NADPH. BSA was used as a control. g, Real-time monitoring of oxidoreductase activity of mutated RTN4IP1 (G215A or R103H) with DCPIP and NADPH (n = 3 independent experiments). w/o, without.

