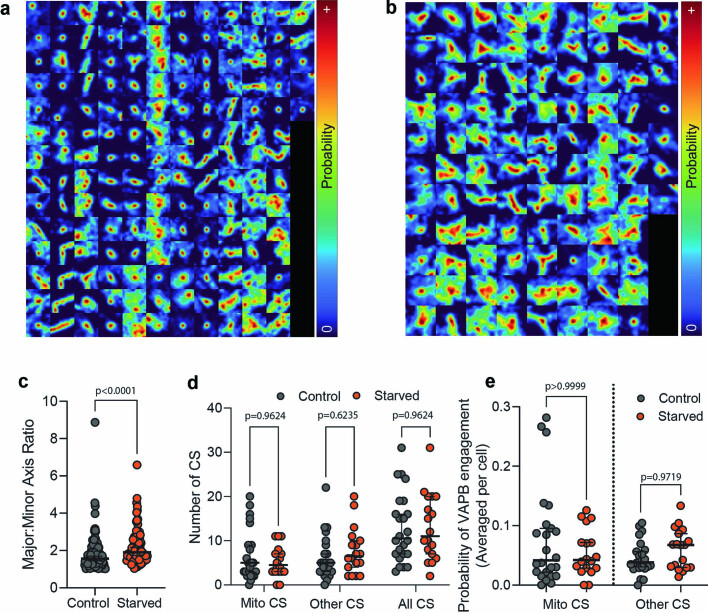
Extended Data Fig. 8. Variability of VAPB contact site size and shape in well fed and starved cells.
a, Spatially-defined probability of VAPB localization in 160 mitochondria-associated contact sites from cells cultured in complete DMEM. A 1.2 µm x 1.2 µm square around the center of each contact site is shown, note that proximal contact sites often appear in the images of their neighbors. b, 96 mitochondria-associated VAPB contact sites displayed as in a), for cells cultured in HBSS for 8 h. Note the asymmetric nature of contact site expansion under these conditions. c, The ratio of Major:Minor axis of ellipse fits to spatially-defined VAPB localization probability within individual contact sites, showing asymmetric expansion of contact sites under nutrient deprivation (n = 160 [Control], 96 [Starved]; p < 0.0001; Mann-Whitney test, two-sided). Error bars indicate the median and 95% confidence interval of the median. d, The number of mitochondria-associated (MitoCS), other structure-associated (OtherCS), or total number of CSs in control cells or cells starved with an 8-hour incubation in HBSS (n = 24 [Control], n = 18 [Starved]; p = 0.9244 MitoCS, p = 0.2780 OtherCS, p = 0.8060 TotalCS; two-sided Mann-Whitney tests with Holm-Šidák threshold for multiple comparisons). Error bars indicate the median and 95% confidence interval of the median. No significant difference observed suggests continued regulation of VAPB at both classes of contact sites. e, The likelihood of VAPB engagement at ERMCSs or other contact sites in control cells or cells starved by 8 h in HBSS, averaged per each cell, showing VAPB is not largely depleted from the ER during starvation as in PTPIP51 overexpression (n = 24 DMEM, n = 18 HBSS; p > 0.9999 MitoCS, p = 0.9719 OtherCS, Dunn’s multiple comparisons test, two-sided). Error bars indicate the median and 95% confidence interval of the median.

