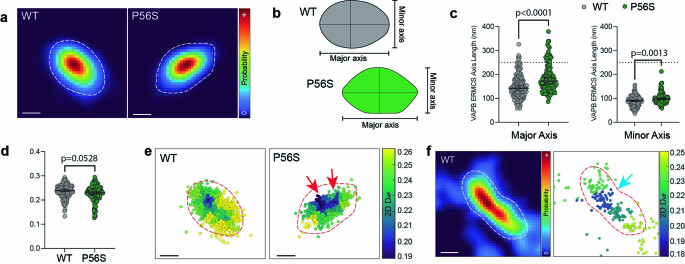
Extended Data Fig. 9. Additional characterization of ERMCS interactions of P56S VAPB molecules.
a, Spatially-defined probability of VAPB localization in representative WT or P56S VAPB-expressing cells. b, Schematic showing approximate major and minor axis of the examples ERMCSs in a. c, The size of the major and minor axes of ellipse fits to the probability of VAPB localization within the ERMCS, showing slight but significant expansion of ERMCSs in P56S VAPB-expressing cells (n = 160 [WT],118 [P56S]; p < 0.0001 Major, p = 0.0013 Minor; Dunn’s multiple comparisons test, two-sided). Error bars indicate the median and 95% confidence interval of the median. d, The 2D Deff of WT or P56S VAPB averaged over entire ERMCSs (n = 160 [WT], 118 [P56S]; p = 0.0528; Dunn’s multiple comparisons test, two-sided). Error bars indicate the median and 95% confidence interval of the median. e, The diffusivity landscape of the WT or P56S VAPB ERMCSs shown in a. Red arrows indicate the asymmetric diffusion well at the center of the P56S VAPB-containing ERMCS. f, An example of a large WT VAPB-containing ERMCS similar in size to the one shown in Fig. 4d, showing a single, central diffusion well at the center of the contact site (blue arrow).

