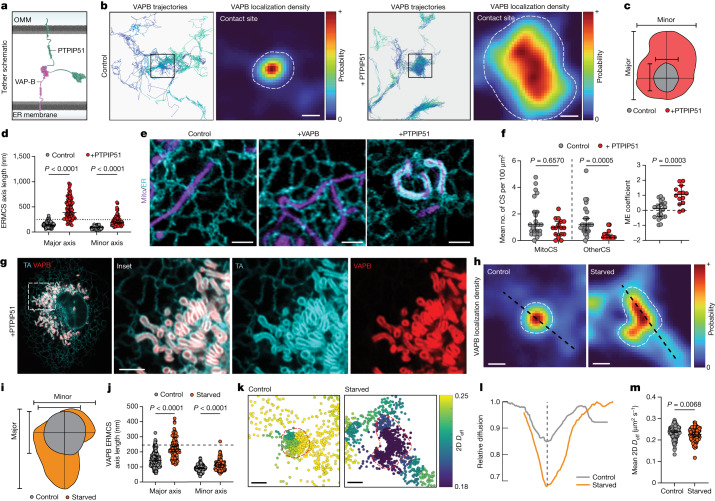
Fig. 3. VAPB contact sites dynamically reorganize according to tether availability and metabolic needs.
a, Cartoon of VAPB-PTPIP51 tethering at an ERMCS. b, Representative trajectories and corresponding localization densities for VAPB at ERMCSs in control (left) or PTPIP51-overexpressing (right) cells. Dashed lines indicate contact site boundaries. c, Overlaid ERMCS footprints from b with axes indicated. d, VAPB-associated ERMCS size in control or PTPIP51-overexpressing cells (n = 160 ERMCSs (control), 64 ERMCSs (+PTPIP51); major P < 0.0001, minor P < 0.0001; Dunn’s multiple comparisons test, two-sided). Line indicates confocal microscopy resolution limit. e, Airyscan micrographs of ER (cyan) and mitochondria (magenta) in either control, VAPB-overexpressing, or PTPIP51-overexpressing cells. f, Number of total VAPB organelle contact sites in control or PTPIP51-overexpressing cells (n = 24 cells (control), 16 cells (+PTPIP51); P = 0.6570, P = 0.0005; Dunn’s multiple comparisons test, two-sided) and mitochondrial enrichment coefficient derived from the same cells (n = 22 cells (control), 14 cells (+PTPIP51); P = 0.0003; Dunnett’s T3 multiple comparisons test, two-sided). g, Airyscan micrograph of TA (cyan) and VAPB (red) in a COS7 overexpressing PTPIP51 (untagged). h, Representative VAPB localization density at ERMCSs in control (complete medium) or starved (HBSS 8 h) cells. Line profiles indicate axes used for i; dashed lines indicate contact site boundaries. i, Overlaid ERMCS footprints from h. j, Contact site size in control or starved cells (n = 160 ERMCSs (control), 96 ERMCSs (starved); major P < 0.0001, minor P < 0.0001; Dunn’s multiple comparisons test, two-sided); line indicates confocal microscopy resolution limit. k, Single-molecule steps associated with the contact sites in h, coloured by the mean 2D Deff in the local neighbourhood. l, Effective 2D diffusion coefficient of VAPB from h, normalized to neighbouring ER regions (dashed line indicates contact site centre). m, Mean 2D Deff within contact sites in either control or starved cells (n = 160 ERMCSs (control), 96 ERMCSs (starved); P = 0.0068; Dunn’s multiple comparisons test, two-sided). Error bars indicate 95% confidence interval of the median. Scale bars, 200 nm (b,h,k), 2.5 µm (e), 2.5 µm (g).

