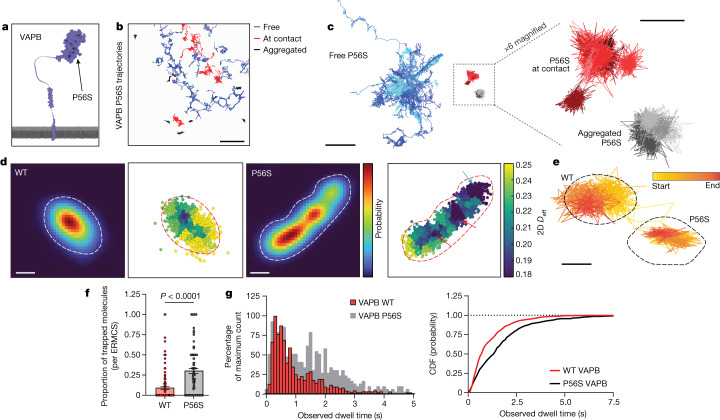
Fig. 4. The ALS-linked VAPB P56S mutation displays aberrant motility at ER–mitochondria contact sites.
a, A cartoon indicating the approximate location of the P56S mutation in the MSP domain of VAPB. b, Selected molecular trajectories of P56S VAPB in a representative COS7 cell. Tracks are colour coded by their primary state of motion (Methods). c, Grouped and overlaid representative trajectory segments of P56S VAPB in COS7 cells. d, Localization density in a representative ERMCS of HaloTag fused to either WT or P56S VAPB and corresponding local diffusion maps. Note the existence of multiple distinct low diffusion wells in the P56S VAPB ERMCS landscape, some of which correspond to high net tether density (red arrows) and some of which do not (blue arrow). Dotted lines delineate the edge of the contact site. e, Single representative ERMCSs of WT or P56S VAPB with the trajectory traversed by a single VAPB molecule plotted above. Note the effective confinement of P56S VAPB resulting in a trapped state, the molecule does not encounter the edges of the ERMCS. f, Quantification of the mean proportion of molecules trapped in WT or P56S VAPB ERMCSs for the full lifetime of the fluorochrome. (n = 160 (WT), 120 (P56S) contact sites, bars show mean ± s.e.m.; P < 0.0001, two-sided Mann–Whitney test). g, Observed dwell times for WT or P56S VAPB molecules in ERMCSs and the associated cumulative distribution function for trajectories in the bound state (n = 734 (WT), 483 (P56S) binding interactions; median values: WT, 715 ms; P56S, 1.358 s). Scale bars, 5 µm (b), 2 µm (c, left), 500 nm (c, right), 200 nm (d), 250 nm (e).

