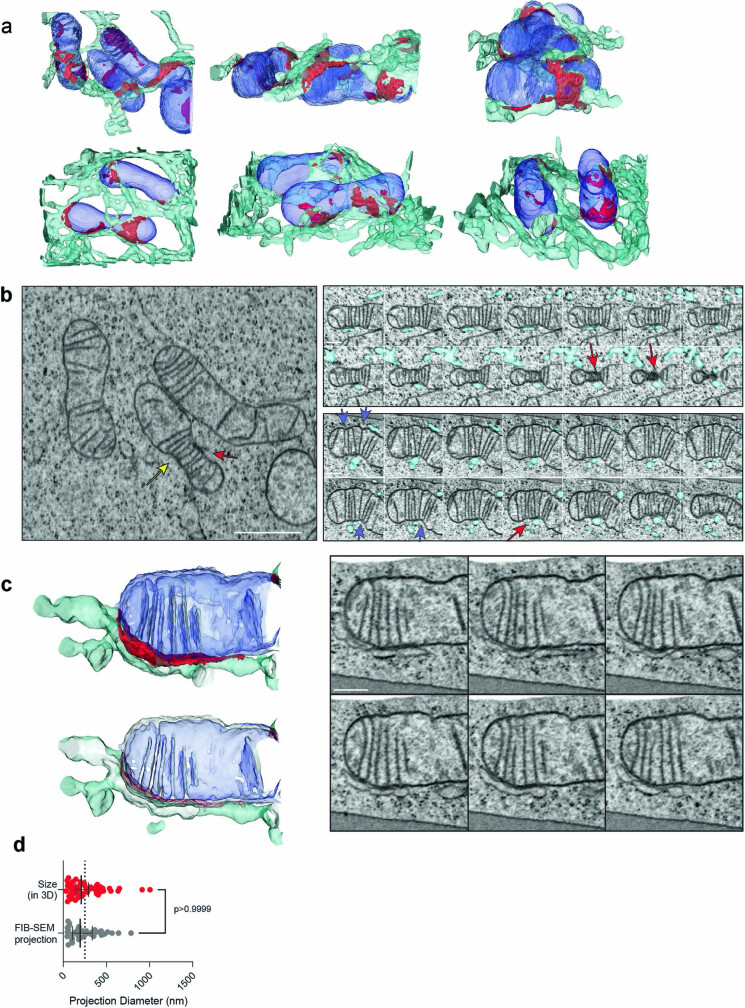
Extended Data Fig. 1. FIB-SEM reveals association of ER-mitochondrial contact sites and known contact site-associated biology.
a, Reconstructed surfaces of ER and mitochondria in association from the FIB-SEM volumes used in this study from several angles. Mitochondria blue, ER cyan, ER membrane within approximate tethering distance of VAPB is colored red. b, Serial slices through an ER-associated site of mitochondrial constriction. Upper panels are every 24 nm from above as viewed in the image to the left, lower panels are every 48 nm from the side of the yellow arrow in the direction of the red arrow in the left image. Red arrows correspond to regions of contact site interface with unusual electron density, presumably associated with mitochondrial division machinery. Blue arrows indicate regions of mitochondrial constriction propagating away from the site of direct contact by the ER, generally aligned with enriched cristae at the site. This is one of two ERMCSs with this architecture in the volume (see Extended Data Fig. 7). c, The site of aligned cristae shown in Fig. 1b with more context. Lower panel is a cut away of the reconstruction above to the central axis of the mitochondria, showing continuity of the cristae with the inner membrane space. Panels to the right are selected single slices of raw EM data through the contact site shown, taken every 64 nm. This is one representative ERMCS of 25 with similar structures throughout the volume. d, Comparison of the measured sizes of ERMCSs in three dimensions from FIB-SEM volumes and the corresponding projection into two dimensions blurred by the resolution of sptPALM. Error bars represent the 95% confidence interval of the median (n = 38 [projected], 52 [three dimensional]; p > 0.9999, Dunn’s multiple comparisons test, two-sided). Note some ERMCSs that are close in space are no longer distinguishable when projected down into two dimensions. Scale Bars: b, 1 µm, inset, 400 nm; c, 400 nm.

