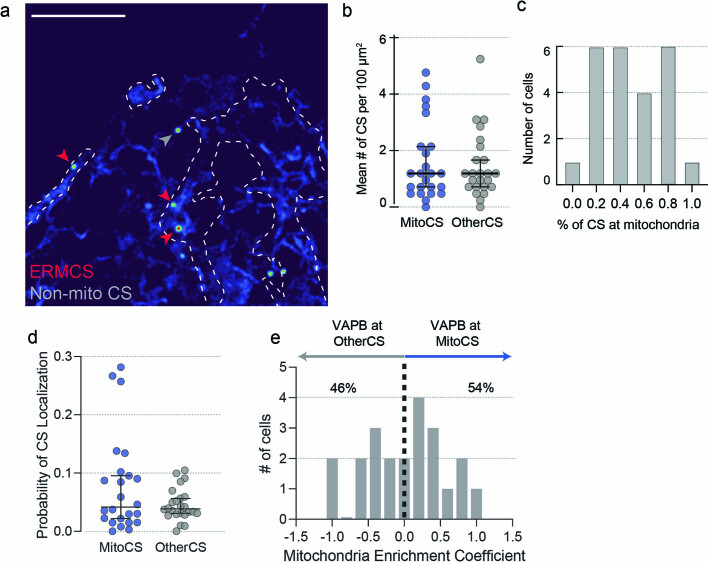
Extended Data Fig. 2. Comparisons of VAPB interactions with mitochondria-associated and non-mitochondria associated structures.
a, The likelihood of VAPB localization in a representative cell, showing hotspots associated with mitochondria (red arrows) and a hotspot associated with other structures (grey arrow). Shown is one cell of 24 collected with various hotspot distributions (see Fig. 1 for other examples). b, Frequency of VAPB contact sites associated with mitochondria or other organelles in COS7 cells (n = 24 cells from 3 experiments). Error bars indicate the median and 95% confidence interval of the median. c, Variability in the proportion of VAPB contact sites that are associated with mitochondria as opposed to other organelles, suggesting adaptability of tether function as a result of cellular needs. d, The probability of a randomly selected VAPB molecule localization being associated with contact sites on mitochondria or other structures, as averaged for each cell (n = 24 cells from 3 experiments). Error bars indicate the median and 95% confidence interval of the median. e, The distribution of mitochondrial enrichment coefficients over the cells in the dataset, showing heterogeneity in tether targets as a result of cellular needs. Scale bars: 500 nm.

