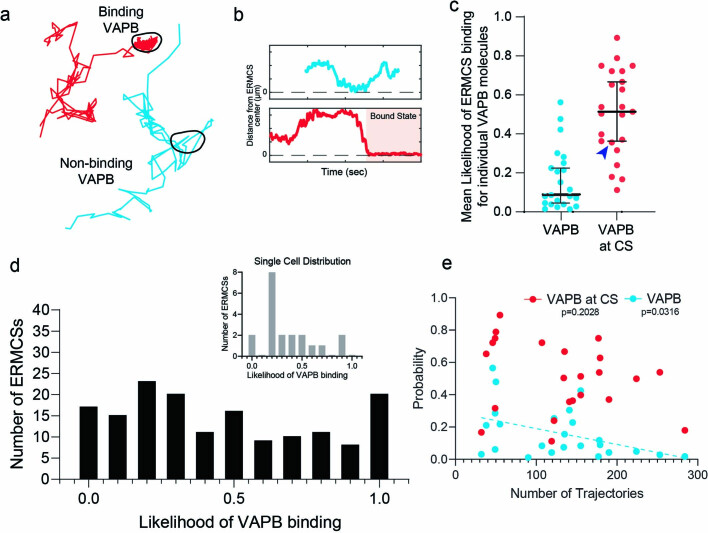
Extended Data Fig. 3. Individual ERMCS show variability in capacity to bind passing VAPB molecules.
a, Two representative trajectories of single VAPB molecules passing the same ERMCS. ERMCS boundary is indicated by the black line. b, Time traces of the trajectories shown in a; the period of direct contact site interaction is indicated by the shaded background. c, The average probability of ERMCS interaction over all VAPB trajectories in a cell or just those that physically encounter an ERMCS, showing the majority of VAPB is freely diffusing in the ER (n = 23 cells). Error bars indicate the median and 95% confidence interval of the median. The blue arrow indicates the cell used as an example in the inset of (d). d, The distribution of likelihoods for VAPB binding, as calculated for individual contact sites (n = 160 contact sites). The inset shows the distribution of the single cell indicated by the blue arrow in c (n = 20 contact sites). e, Average likelihood of individual VAPB molecules engaging with ERMCSs as a function of VAPB expression level. Note that the probability of ERMCS-associated VAPB engagement is uncorrelated to VAPB expression level, suggesting the law of mass action is satisfied (n = 24 cells; p = 0.2028 VAPB, p = 0.0316 VAPB at ERMCS; two-sided F-test, dFn=1 dFd=22, testing significance of the slope being different from zero).

