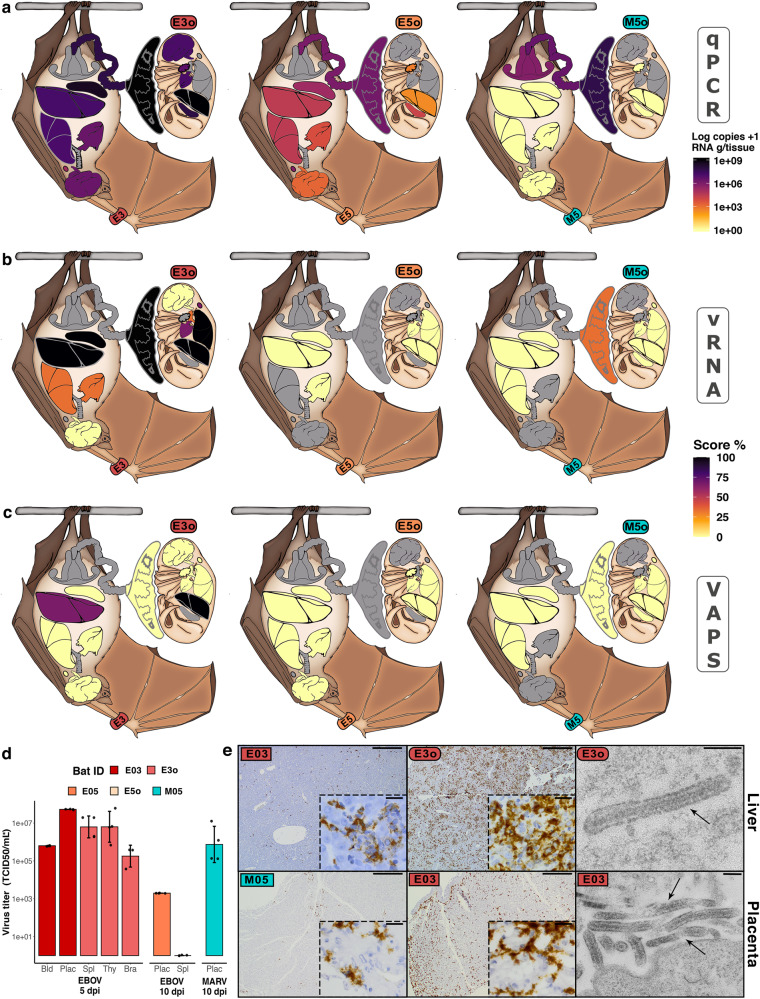
Fig. 4. Dissemination of filoviruses in experimentally inoculated pregnant Angolan free-tailed bats (AFBs).
a–c Representation of EBOV and MARV distribution in selected organs. a Heatmap representations of viral RNA measured by qRT-PCR (qPCR), shown as log10 copies/g tissue. b Score of viral RNA abundance (intensity within cells) detected using ISH-RNA (vRNA) targeting EBOV-VP40 or MARV-NP-VP35-VP40. c Virus-associated pathology score (VAPS), designated as co-localization of histopathological lesions with vRNA. Min-max normalization of IHC and VAPS scores are shown as percentages. Unavailable organs are depicted by grey. Lymph nodes (ovals) are mesenteric (histology) and cervical (q-RT-PCR). Abbreviations: Bld=Blood, Plac=Placenta, Spl=Spleen, Thy=Thymus and Bra=Brain. d TCID50 virus titration (g tissue or ml of blood) of tissues sampled from pregnant bats (n = 5 biologically independent animals). Data shows mean ± SD from 4 technical replicates of each sample (n = 8 biologically independent tissue samples). e Photomicrographs of liver and placental tissues showing: ISH-RNA targeting EBOV-RNA of E03, E3o livers and E03 placenta; ISH-RNA targeting MARV-RNA of M05 placenta; and thin section electron microscopy (EM) of typical filamentous EBOV particles in the extracellular space of E3o liver and E03 placenta (right panels). Black arrows show enveloped virus particles of 85–125 nm in width, variable in length and that contain a rod-like nucleocapsid (see also Fig. S1). Scale bars: 500 µm (zoom-box: 20 µm) and EM: 200 nm. Source data are provided as a Source Data file.

