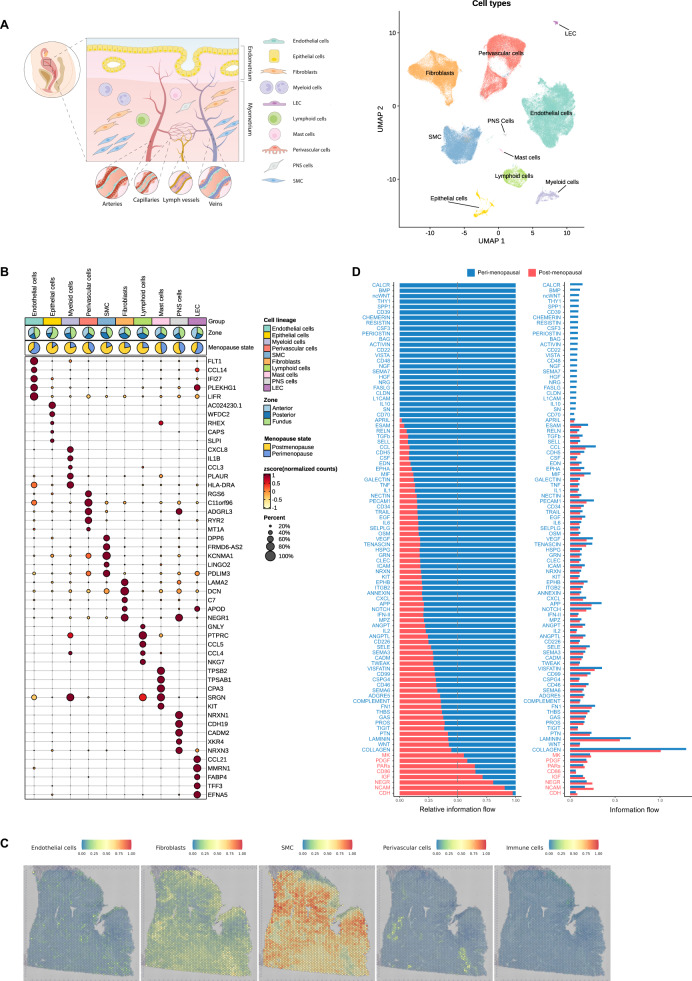
Fig. 1. Integrated Single-Cell Atlas of the Human Myometrium.
A Schematic representation of the human uterus and identified cell types within the myometrium (left). Visualization of uniform manifold approximation and projection (UMAP) showing an integrative clustering of high-quality cells/nuclei from human myometria (perimenopausal, n = 6; postmenopausal, n = 14) at 0.5 resolution (right). B Dotplot indicating the relative expression of each identified cell type’s top five discriminatory genes (color indicates average expression, while dot size represents the percentage of cells expressing specific genes). Pie charts illustrate the proportion of cells according to menopausal state (perimenopause in blue, postmenopause in yellow) and myometrial zone (light blue -anterior region, dark blue - posterior region, and green - fundus). C Panels displaying the spatial location of endothelial cells, fibroblasts, SMCs, PV cells, and immune cells in the myometrium. D Relative and absolute flows of differentially active signaling pathways during myometrial aging (comparing perimenopausal and postmenopausal myometria). LECs lymphatic endothelial cells, PNS peripheral nervous system, SMCs smooth muscle cells.

