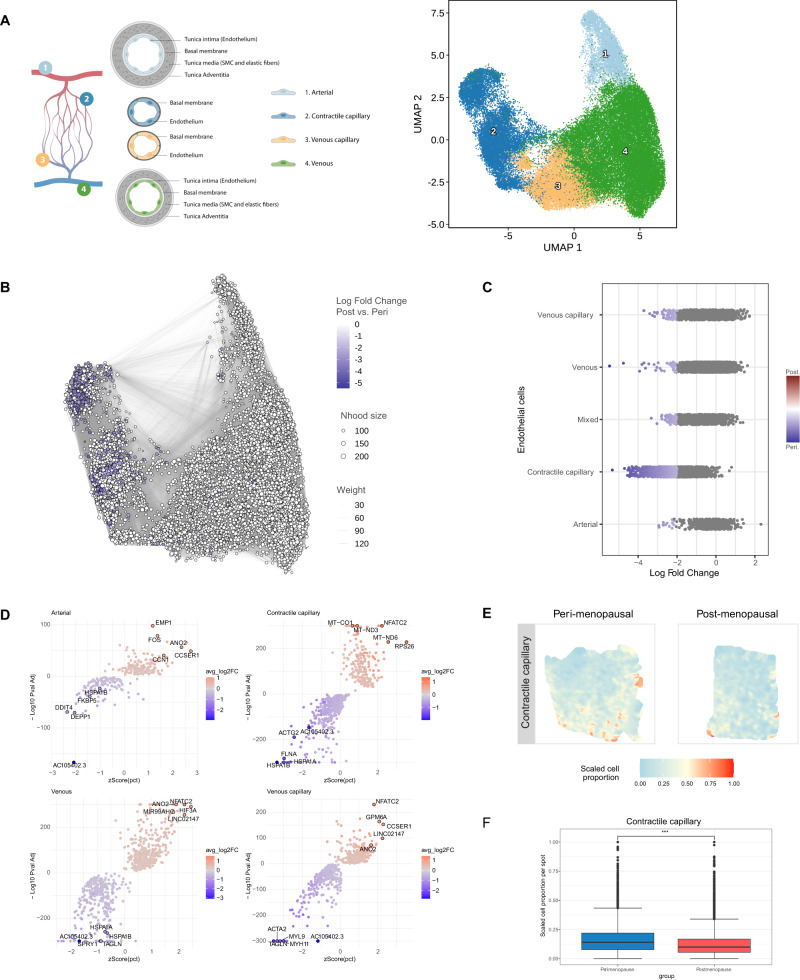
Fig. 2. Endothelial Dysfunction in the Aging Myometrium.
A Schematic representation of the endothelial cells (left) and UMAP visualization of the principle endothelial subpopulations in the myometrium at 0.5 resolution (right). B Neighborhood graph highlighting the differential abundance of endothelial cells in the aging myometrium. Dot size represents neighborhoods, while edges depict the number of cells shared between neighborhoods. Neighborhoods colored in blue represent those with a significant decrease in cell abundance during myometrial aging. C Beeswarm plot of differential cell abundance by cell type. X-axis represents the log-fold change in abundance during myometrial aging. Each dot represents a neighborhood; neighborhoods colored in blue represent those with a significant decrease in cell abundance in postmenopausal myometria. D Volcano plots representing age-related differentially expressed genes in each endothelial cell subpopulation. Positive LogFC indicates overexpression in the postmenopause myometrium, whereas negative LogFC indicates overexpression in the perimenopausal myometrium. The statistical test applied was a MAST test with p-values corrected for multiple comparisons by FDR. E Representative refined spatial maps of contractile capillary cells in the perimenopausal (left) and postmenopausal (right) myometrium (n = 3 peri and 5 post-menopausal samples). Colors represent the scaled proportion of this cell type in each location (red indicates the highest proportion of contractile capillary cells in that tissue). F Boxplot of the scaled cell proportions of contractile capillary per spot split in the postmenopausal and perimenopausal myometrium (n = 3 peri and 5 post-menopausal samples; the center line shows the median for the data and error bars extend to the largest and smallest value no further than 1.5 inter-quartile range; Unpaired two-sided Wilcoxon test where ***p value < 2.2e−16). Nhood size Neighborhood size. Source data are provided as a Source Data file.

