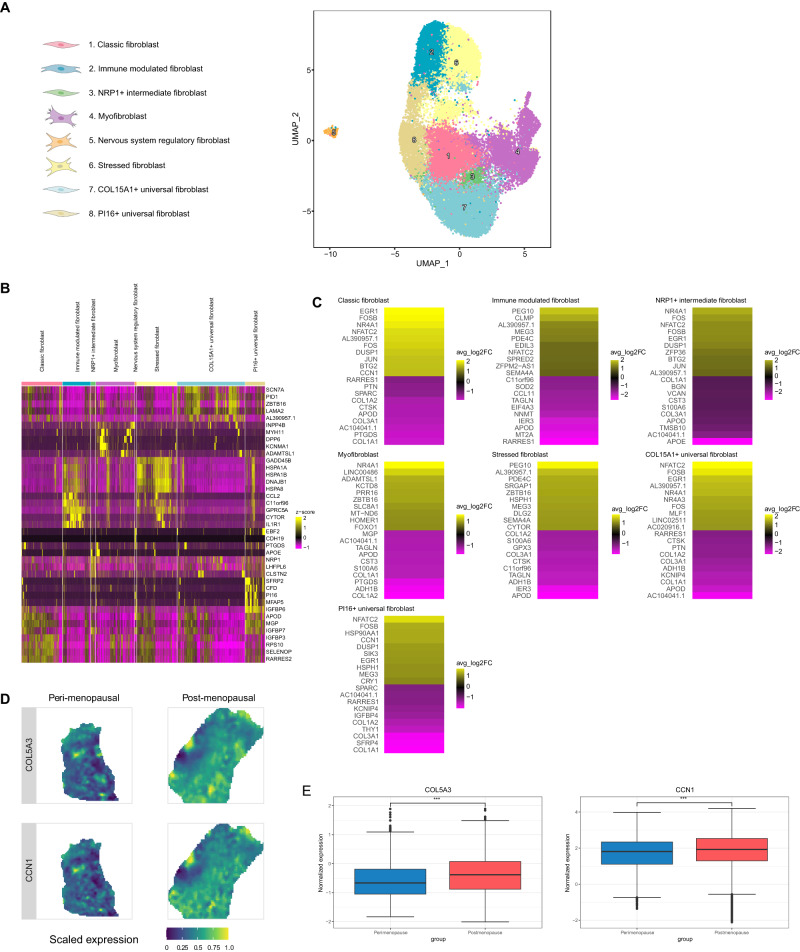
Fig. 3. Age-related changes in the myometrial fibroblast population.
A UMAP visualization displaying the fibroblast subpopulations in the myometrium at 0.6 resolution. B Heatmap showing the relative expression of the top five discriminatory genes in each subpopulation. C Heatmap showing the genes with the top ten highest and lowest LogFC values in the postmenopausal vs. perimenopausal myometrium for each subpopulation. Positive LogFC indicates overexpression in the postmenopausal myometrium, whereas negative LogFC indicates overexpression in the perimenopausal myometrium. D Representative refined spatial maps of the expression of COL5A3 and CCN1 in the perimenopausal (left) and postmenopausal (right) myometrium (n = 3 peri and 5 post-menopausal samples). Color indicates expression levels in each spot (yellow indicates the highest expression of each gene in the tissue). E Boxplot of the spatial expression of the collagen COL5A3 (left) and fibroblast senesce marker CCN1 (right) genes in the perimenopausal and postmenopausal myometrium (n = 3 peri and 5 post-menopausal samples; the center line shows the median for the data and error bars extend to the largest and smallest value no further than 1.5 inter-quartile range; Unpaired two-sided Wilcoxon test where ***p value < 2.2e−16). Source data are provided as a Source Data file.

