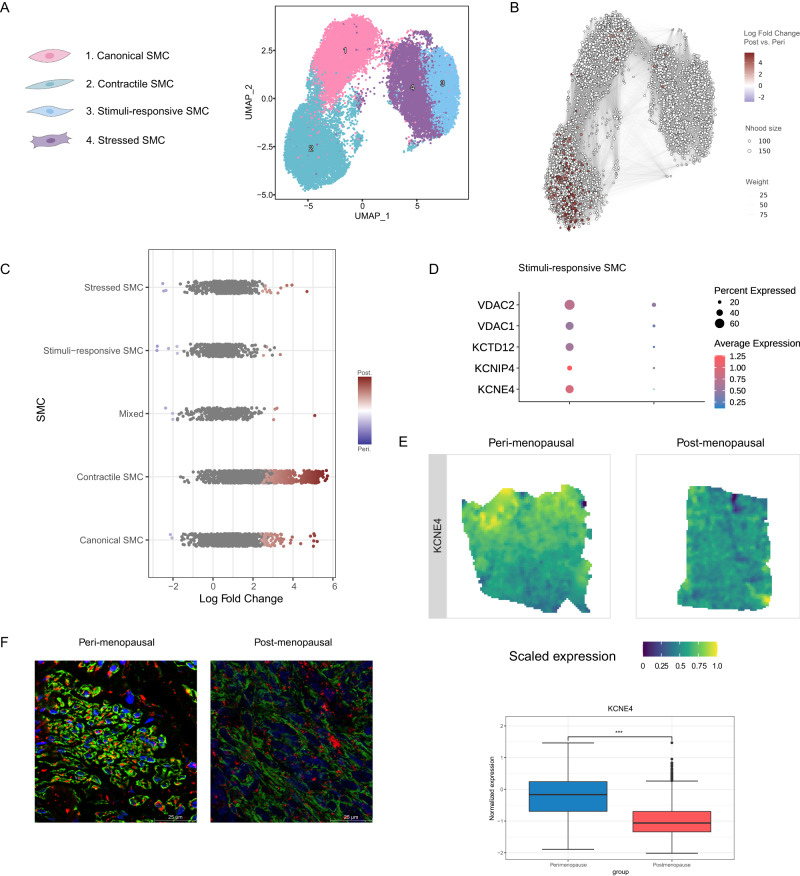
Fig. 4. Increased abundance but reduced functionality of SMCs accompanies myometrial aging.
A UMAP visualization of the four distinct SMC subpopulations. B Neighborhood graph highlighting the differential abundance of SMCs in the aging myometrium. Neighborhoods colored in dark red represent those with significantly increased abundance in the postmenopausal myometrium at 0.6 resolution. C Beeswarm plot of differential SMC abundance by cell type. D Dot plots representing the differential gene expression of voltage channel encoding genes during myometrial aging in stimuli-response SMCs. Dot size indicates the percentage of stimuli-response SMC that express the gene, while color indicates average expression. E Spatial expression (top) and boxplot (bottom) of potassium voltage-gated channel gene KCEN4 in representative refined spatial maps of perimenopausal (n = 3; left) and postmenopausal (n = 5; right) myometrium, where color indicates expression levels in each spot (the center line shows the median for the data and error bars extend to the largest and smallest value no further than 1.5 inter-quartile range; Unpaired two-sided Wilcoxon test where ***p value < 2.2e−16). F Representative inmunofluorescence image of ACTA2 (green) and VDAC1/2 (red) in peri (n = 3; left) and postmenopause (n = 3; right). Scale bar = 25 µm. SMC smooth muscle cells, Nhood size Neighborhood size, ACTA2 Actin Alpha 2, VDAC1/2 Voltage-dependent anion-selective channel 1/2. Source data are provided as a Source Data file.

