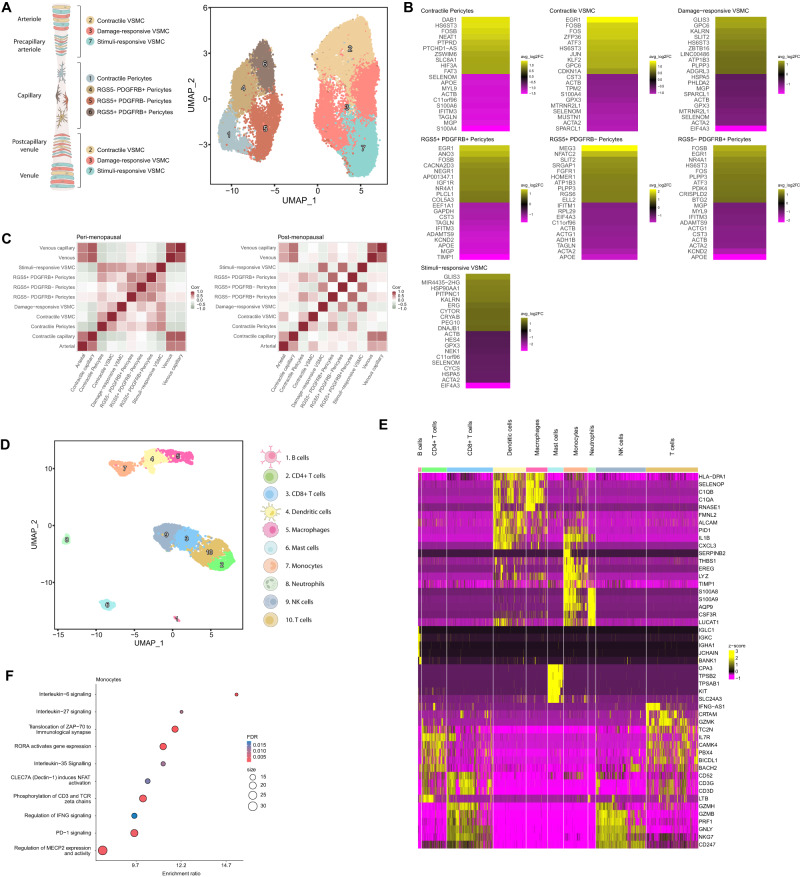
Fig. 5. Impairments in the Myometrial Perivascular and Immune Cell Populations Associated with Myometrial Aging.
A Schematic representation of PV subtypes surrounding the myometrial microvasculature from the arteriole to the venule: arterioles and venules are surrounded by a single layer of contractile VSMCs, while pericytes (characterized by a stellate shape) are usually found surrounding smaller and transitional vessels such as precapillary arterioles and postcapillary venules. Contractile pericytes provide support in capillaries (left). UMAP visualization displaying the PV subpopulations at 0.8 resolution (right). B Heatmap showing the genes with the top ten highest and lowest LogFC values in the postmenopausal vs. perimenopausal myometrium for each PV subpopulation. Positive LogFC indicates overexpression in the postmenopausal myometrium, whereas negative LogFC indicates overexpression in the perimenopausal myometrium. C Correlation of the spatial distribution of endothelial and PV cell populations in the perimenopausal (left) and postmenopausal (right) myometrium, with color scaled by correlation value (darker red indicates a higher correlation between the location of the indicated cell types). D UMAP visualization displaying the immune cell sub-clusters present in the myometrium at 0.5 resolution. E Heatmap showing the relative expression of the top five discriminatory genes in each subpopulation. F Dotplot showing the representative biological processes and pathways affected in monocytes during myometrial aging based on differential gene expression. Significant over-representation of biological processes and pathways (color intensity) shown by each gene set (dot size) from perimenopausal and postmenopausal monocytes. VSMC vascular smooth muscle cells, NK natural killer, FDR false discovery rate.

