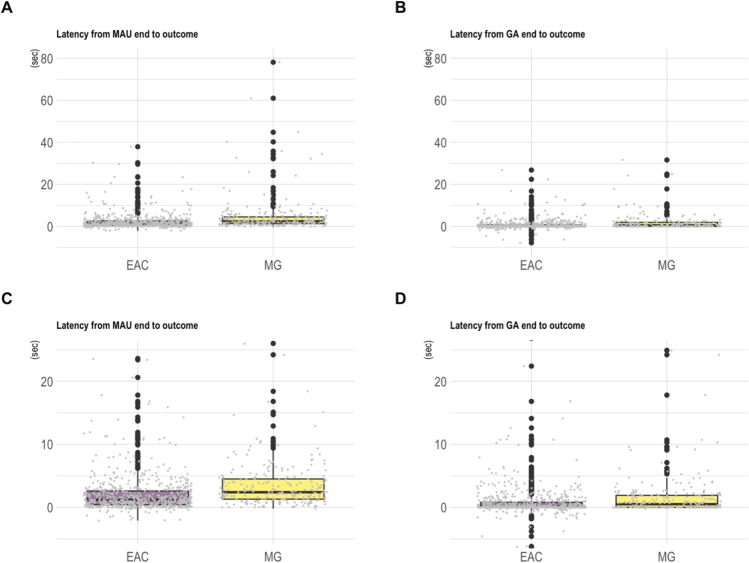
Fig. 6.
Worked example 2.2: Mountain gorilla and chimpanzee recipient latencies to (behaviourally) respond to a signaller’s gestures (successful communications, all goals except ‘play’). Note. Boxplots showing the response waiting times (latencies to respond) in East African chimpanzees (EAC) and mountain gorillas (MG) in 958 successful communications (MG: n = 250 communications, n = 37 signallers; EAC: n = 707 communications, n = 115 signallers – including all gesture actions, excluding the goal ‘play’ – data in ESM: Worked_example_2.2_data.csv) when considering either the MAU end point (A and C) or the gesture action end point (B and D) as starts of response waiting. The graph A includes the full range of latency values observed for MAU end to Outcome (range: – 2.1–78.1) and graph B the full range of latency values for Gesture action end to Outcome (range: – 7.8–31.6) while the graphs C and D show only those latencies with values between – 5 and 25 s (for a better resolution on where the majority of the data lies, while not omitting the more extreme values from the scaling). The data suggest that mountain gorillas take longer to respond to gestural requests as compared to chimpanzees when considering the MAU end point as the start of response waiting as well as when considering the GA end point as the start of response waiting. As in worked example 2.1, the negative latencies result from instances where the recipient already responded to the gesture before the respective action phase (MAU and/or GA) was completed

