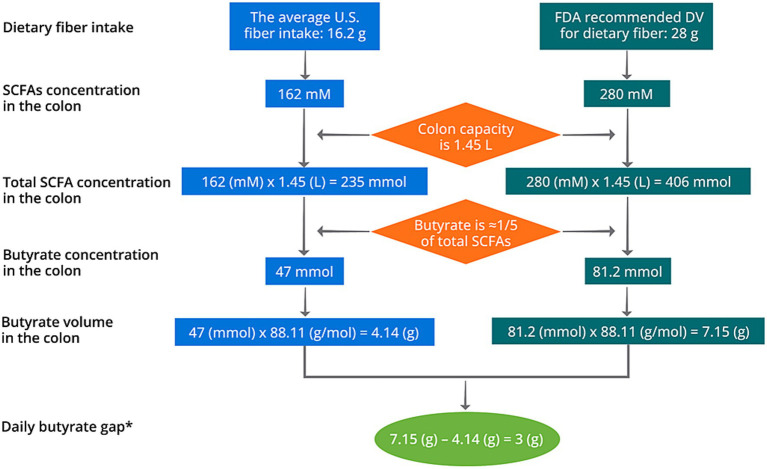
Figure 5.
Schematic diagram of the calculation of daily butyrate gap in the United States. *The daily butyrate gap solely represents the short of butyrate production based on fiber deficit. It does not indicate that the health outcomes generated from fiber deficit is a result from the gap of colorectal butyrate production.

