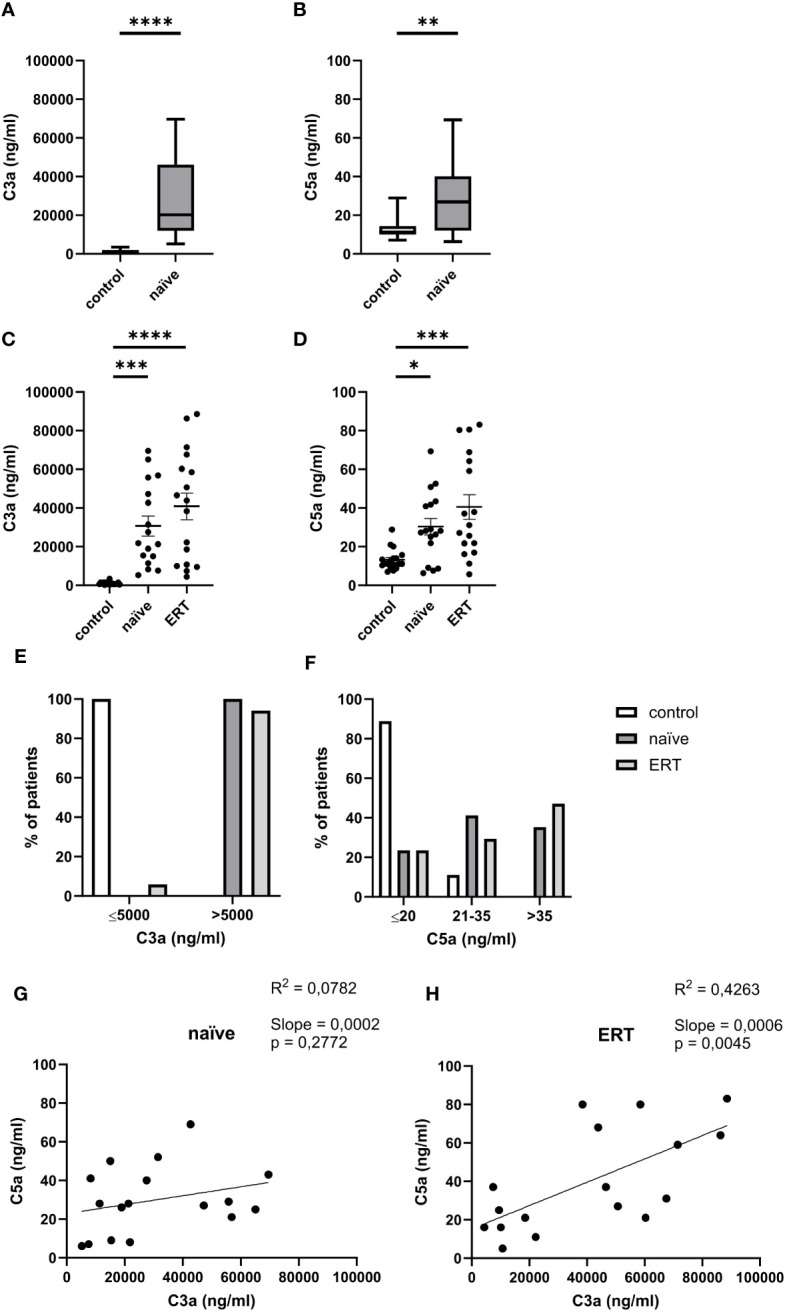
Figure 1.

Serum concentrations of C3a and C5a in FD patients. (A) C3a and (B) C5a concentrations (ng/ml) in serum samples from healthy controls (n=18) and treatment-naiüve (n=24) FD patients. (C) C3a and (D) C5a concentrations (ng/ml) in serum samples from healthy controls (n=18), treatment-naiüve FD patients and from the same patients under ERT (n=17). Data were tested for normal distribution by Kolmogorov-Smirnov test. Differences between groups were determined by Mann-Whitney test (A, B) when data were not normally distributed or Ordinary one-way ANOVA with Tukey’s posthoc test (C, D) in case of normal distribution. Data in A, B are shown as median and range with 25th and 75th percentile. Data in (C, D) are shown as mean + SEM (C, D). *p<0.05, **p<0.01; ***p<0.001; ****p<0.0001. (E, F) Percentage of serum samples from healthy controls (white bar, n=18), treatment-naiüve FD patients (black bar, n=17) and from the same patients under ERT (grey bar, n=17) with levels of (E) ≤5,000 ng/ml or >5,000 ng/ml of C3a or (F) ≤20 ng/ml, 21-35 ng/ml or >35 ng/ml C5a in serum. (G, H) Linear regression analysis of C5a and C3a serum levels (ng/ml) in FD patients before (G) and after (H) ERT (n=17). R2 is the coefficient of determination of linear regression and ranges from 0 (no linear regression) to 1 (perfect linear regression).
