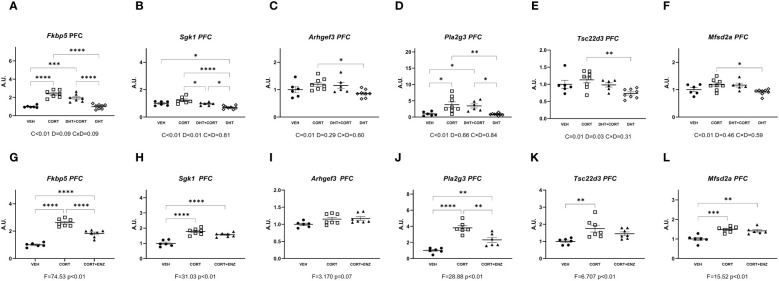
Figure 3.
Gene expression in prefrontal cortex. (A-F) Expression of GR responsive genes in prefrontal cortex (PFC), obtained from experiment 1. 2-way ANOVA main effects are depicted below the x axis as: C, Corticosterone; D, Dihydrotestosterone; CxD, Interaction. (G-L) expression of GR responsive genes in prefrontal cortex (PFC), obtained from experiment 2. 1-way ANOVA values of F-statistic and p are depicted below the x axis. VEH, vehicle; CORT, Corticosterone; CORT+ENZ, Corticosterone in combination with Enzalutamide. *p<0.05, **p<0.01, ***p<0.001, ****p<0.0001.

