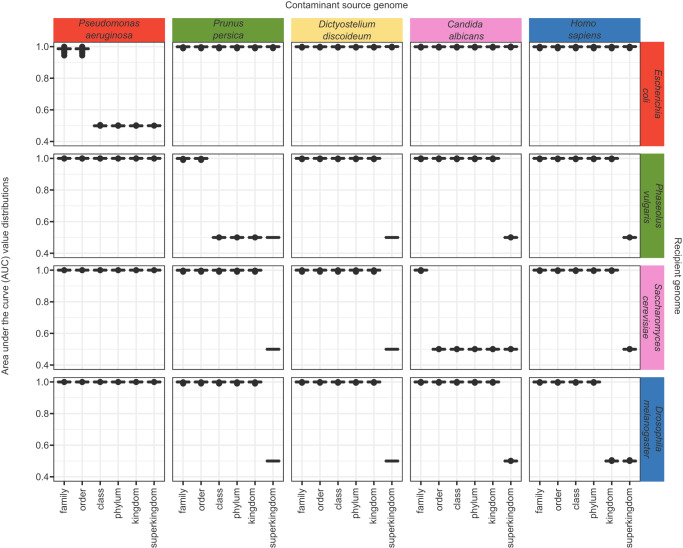
Fig. 2. Performance of ContScout on synthetic data.
Artificially contaminated genomes were created by transferring varying numbers of proteins between all possible combinations of source and target proteomes. Proteins were then classified by ContScout as either contamination or host. Matrix of boxplots shows distributions of the calculated area under the curve (AUC) values where column position of charts corresponds to the contamination source genome while row positions indicate the recipient genome. Within each of the boxplots, axis x refers to the taxonomic rank at which decontamination was performed. At each rank, 100 independent ContScout runs were carried out, each of them with 400 randomly selected source proteins being spiked in. See Supporting Fig. 1 for all genome combinations and all spike-in levels located under 10.6084/m9.figshare.23507517. Source data are provided as a Source Data file.

