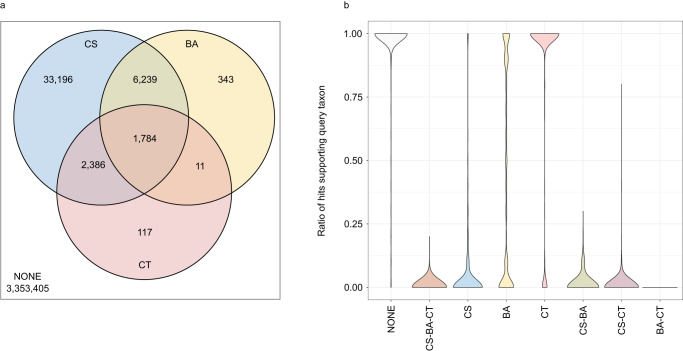
Fig. 3. Performance comparison between ContScout, Conterminator and BASTA.
Proteins from the two hundred most contaminated genomes were assigned into eight categories according to the tools that detected them as contaminants. Venn diagram (a) shows the number of proteins in each detection category. Letters are as follows: CS: Detected by ContScout, CT: Detected by Conterminator, BA: Detected by BASTA, NONE: Detected by none of the tools. For each query sequence, a taxonomy support value was calculated based on the top 10 hits from the taxonomy-aware UniRef100 database. Violin plots (b) summarize taxonomy support ratio distributions within each protein category where value one means perfect support from queries while zero means complete disagreement between the taxonomy label of the query and that of its top hits. Color coding of the violin plots, as well as the letter combinations used in their x axis labels correspond to the different areas of the Venn diagram. Source data are provided as a Source Data file.

