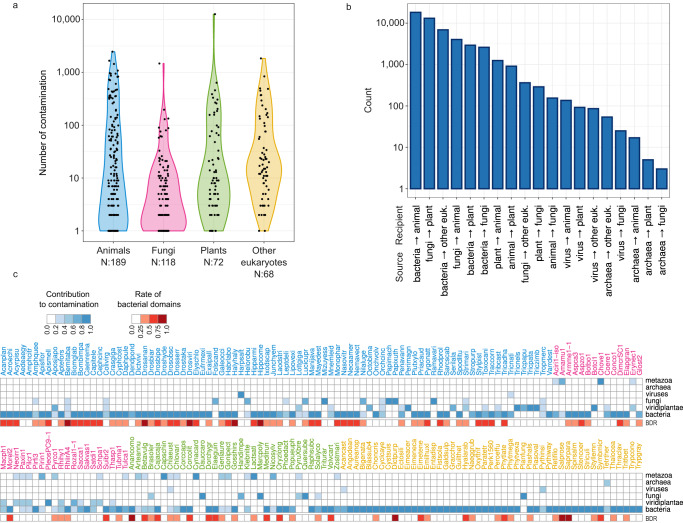
Fig. 5. Summary of contamination statistics across 844 genomes.
a Violin plot showing the number of contaminant proteins detected in 844 eukaryote genomes. Proteomes with no contamination (N: 397) were omitted from the plot. Violin plots are colored according to the taxonomic lineages of the tested genomes with blue color representing animals, purple corresponding to fungi, green standing for plants and orange for other eukaryotes. b Bar plot summarizing the numbers of proteins between each detected contamination-recipient pair. Pairs are charted in decreasing order. c Heatmap (cells in shades of blue) indicate the contributions of each high-level taxa to contaminants detected in each of the top 200 contaminated genomes. Heatmap label colorings matches the color coding used for the violin plots in panel a, as described in the figure legend above. For full-length species names, see Supplementary Data 3. BDR (cells in shades of red) corresponds to the ratio of domains of bacterial origin among the domains detected on contaminant proteins. Source data are provided as a Source Data file.

