. 2024 Jan 11;84(3):493–508. doi: 10.1158/0008-5472.CAN-22-2654

Figure 3.

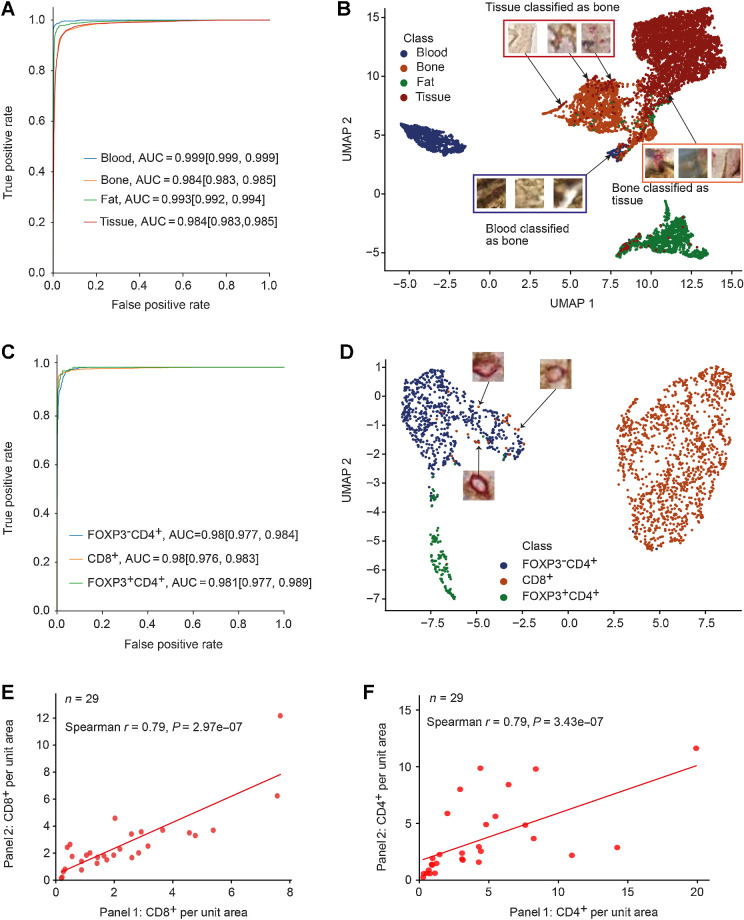
Figure 3. Performance evaluation of MoSaicNet and AwareNet deep learning models: A, The ROC curves and AUC values of the MoSaicNet superpixel classifier. The values in brackets indicate the 95% CI. B, Two-dimensional mapping of superpixels using MoSaicNet learned 200-dimensional features after dimensionality reduction by UMAP. C, The ROC curves and AUC values of single-cell classifier model on separately held test data. The values in brackets indicate the 95% CI. D, UMAP features visualization of deep learned features by AwareNet single-cell classifier CNN. E and F, Validation of AwareNet model using correlation of density of CD8+ (E) and CD4+ (F) cells in panel 1 and panel 2.

Performance evaluation of MoSaicNet and AwareNet deep learning models: A, The ROC curves and AUC values of the MoSaicNet superpixel classifier. The values in brackets indicate the 95% CI. B, Two-dimensional mapping of superpixels using MoSaicNet learned 200-dimensional features after dimensionality reduction by UMAP. C, The ROC curves and AUC values of single-cell classifier model on separately held test data. The values in brackets indicate the 95% CI. D, UMAP features visualization of deep learned features by AwareNet single-cell classifier CNN. E and F, Validation of AwareNet model using correlation of density of CD8+ (E) and CD4+ (F) cells in panel 1 and panel 2.