Figure 4.
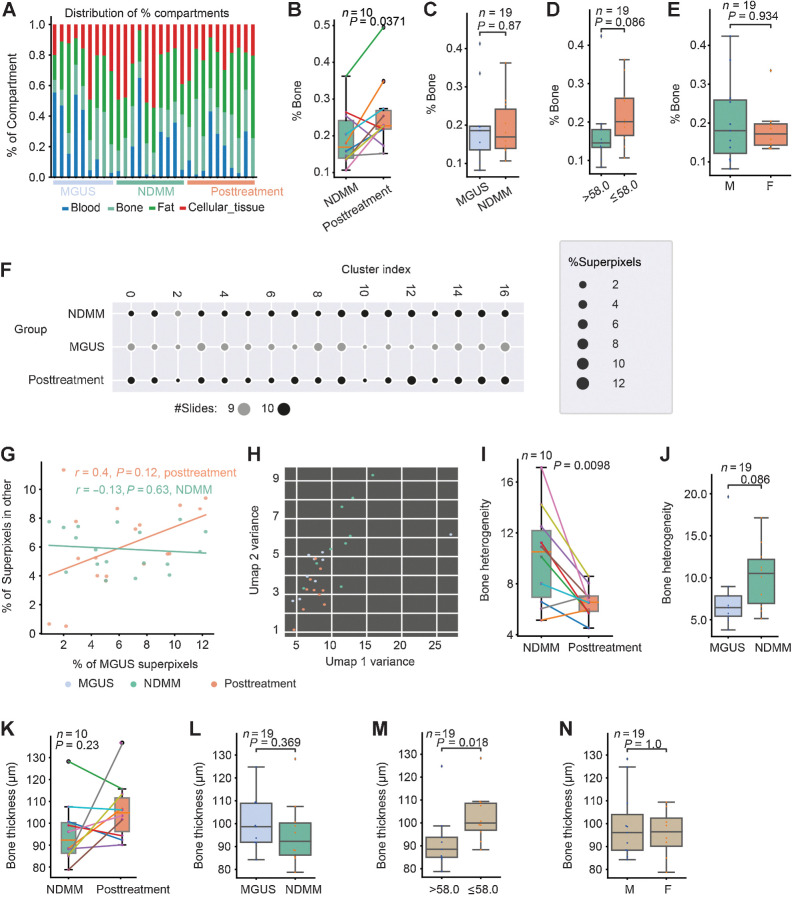
Studying bone physiology using MoSaicNet. A, Proportion of different compartments of BM trephine digital images. B–E, One stacked bar represents a sample. Box plots showing the difference in %bone between samples from NDMM and posttreatment (B), MGUS and NDMM (C), different age groups (median age = 58.0 years; D), and gender groups (E). F, Scatter plot showing the number of bone superpixels in 17 clusters from MGUS, NDMM, and posttreatment samples. The size of the dots represents the percentage of superpixels. The color represents the number of slides in each cluster. G, Correlation of percentage of superpixels in each cluster between different patient groups. A point represents a cluster. H, Scatter plot of slide-level heterogeneity of bone features measured by features variance (Supplementary Materials and Methods). A point represents a patient/slide. I and J, Box plots showing differences in bone density heterogeneity between NDMM and posttreatment (I), and between MGUS and NDMM (J). K–N, Box plots showing the difference in bone thickness between samples from NDMM and posttreatment (K), MGUS and NDMM (L), and different age groups (median age = 58.0 years; M) and gender (N).

