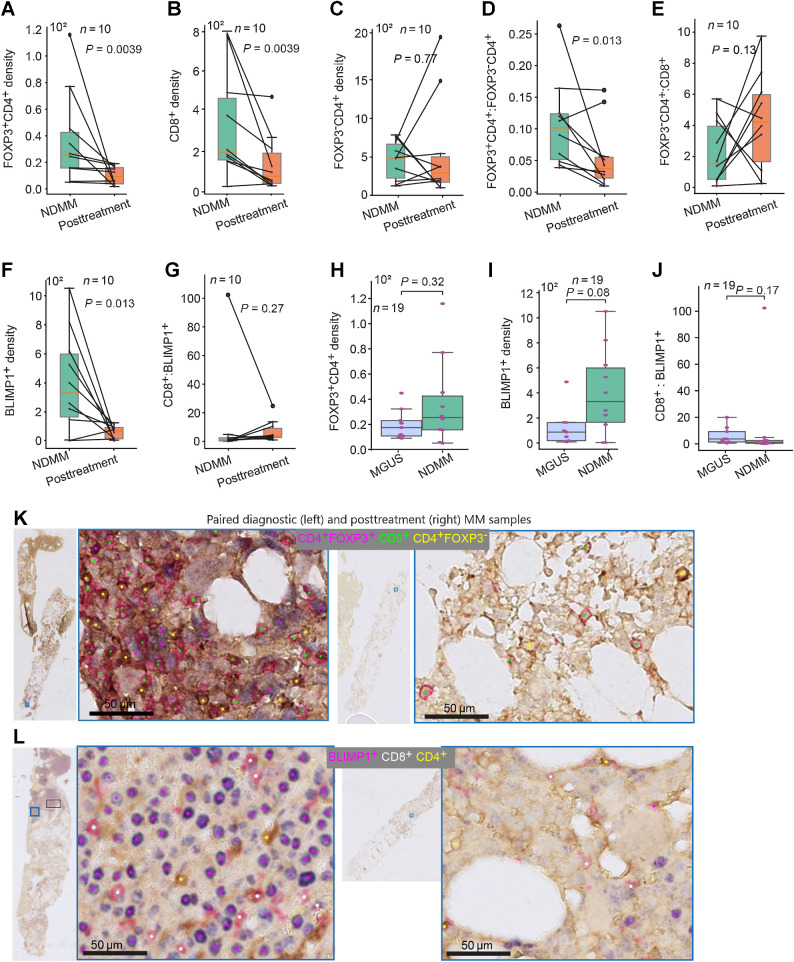
Figure 5.
Density of immune T cells and plasma cells in MGUS, NDMM, and posttreatment samples. A–G, Box plots showing the difference in density of FOXP3+CD4+ (A), the density of CD8+ (B), the density of FOXP3−CD4+ (C), FOXP3+CD4+:FOXP3−CD4+ ratio (D), FOXP3+CD4+:CD8+ ratio (E), density of BLIMP1+ (F), and CD8+:BLIMP1+ ratio (G) between paired NDMM samples and posttreatment samples (n = 10 pairs). H–J, Box plot showing the difference in density of FOXP3+CD4+(H), the density of BLIMP1+ cells (I), and CD8+:BLIMP1+ cells (J) between MGUS and NDMM samples (n = 19). K and L, Sample images showing the reduction of the density of FOXP3+CD4+ and CD8+ cells (K) and BLIMP1+ cells (L) at posttreatment compared with paired NDMM samples. The cell density is presented per 1 mm2 tissue area.

