. 2023 Sep 21;30(3):542–553. doi: 10.1158/1078-0432.CCR-23-1444

Figure 4.

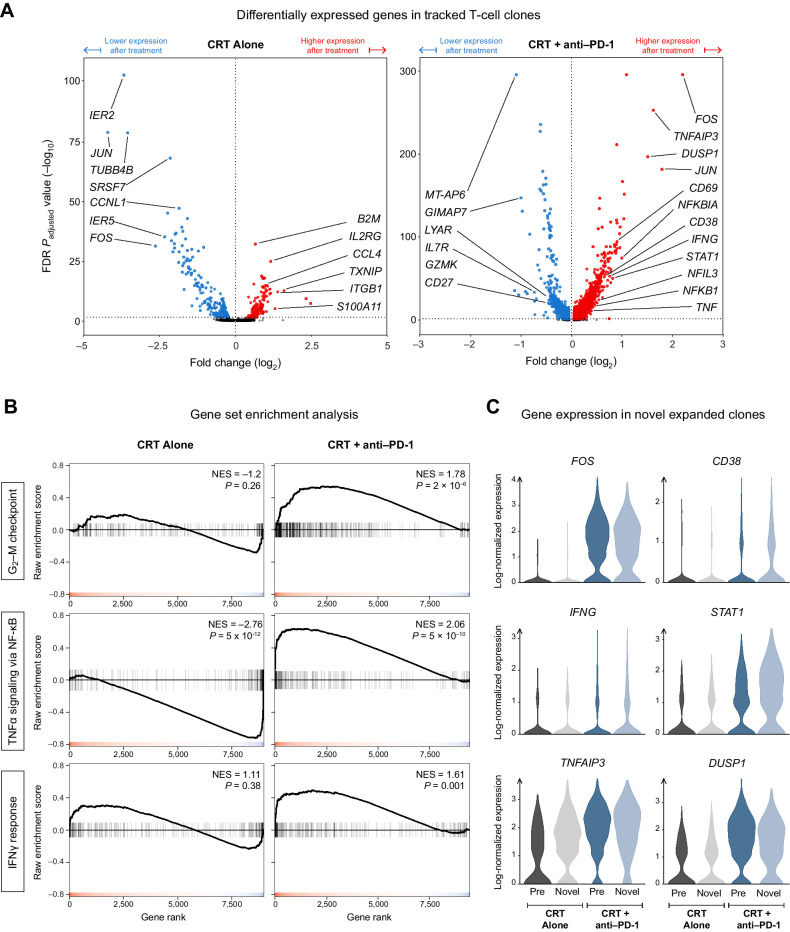
Figure 4. PD-1 blockade induces the AP-1, NF-κB, and IFN transcriptional programs in the T cells of patients with PDAC. A, Volcano plot showing the differentially expressed genes (DEG) over the treatment period among T-cell clones that were present in both pre- and posttreatment samples. B, Gene Set Enrichment Analysis (GSEA) of three hallmark gene sets for the DEGs obtained in (A). C, The posttreatment expression of key genes from the hallmark pathways in (B) among novel expanded cells in comparison with pre-existing expanded cells.

PD-1 blockade induces the AP-1, NF-κB, and IFN transcriptional programs in the T cells of patients with PDAC. A, Volcano plot showing the differentially expressed genes (DEG) over the treatment period among T-cell clones that were present in both pre- and posttreatment samples. B, Gene Set Enrichment Analysis (GSEA) of three hallmark gene sets for the DEGs obtained in (A). C, The posttreatment expression of key genes from the hallmark pathways in (B) among novel expanded cells in comparison with pre-existing expanded cells.