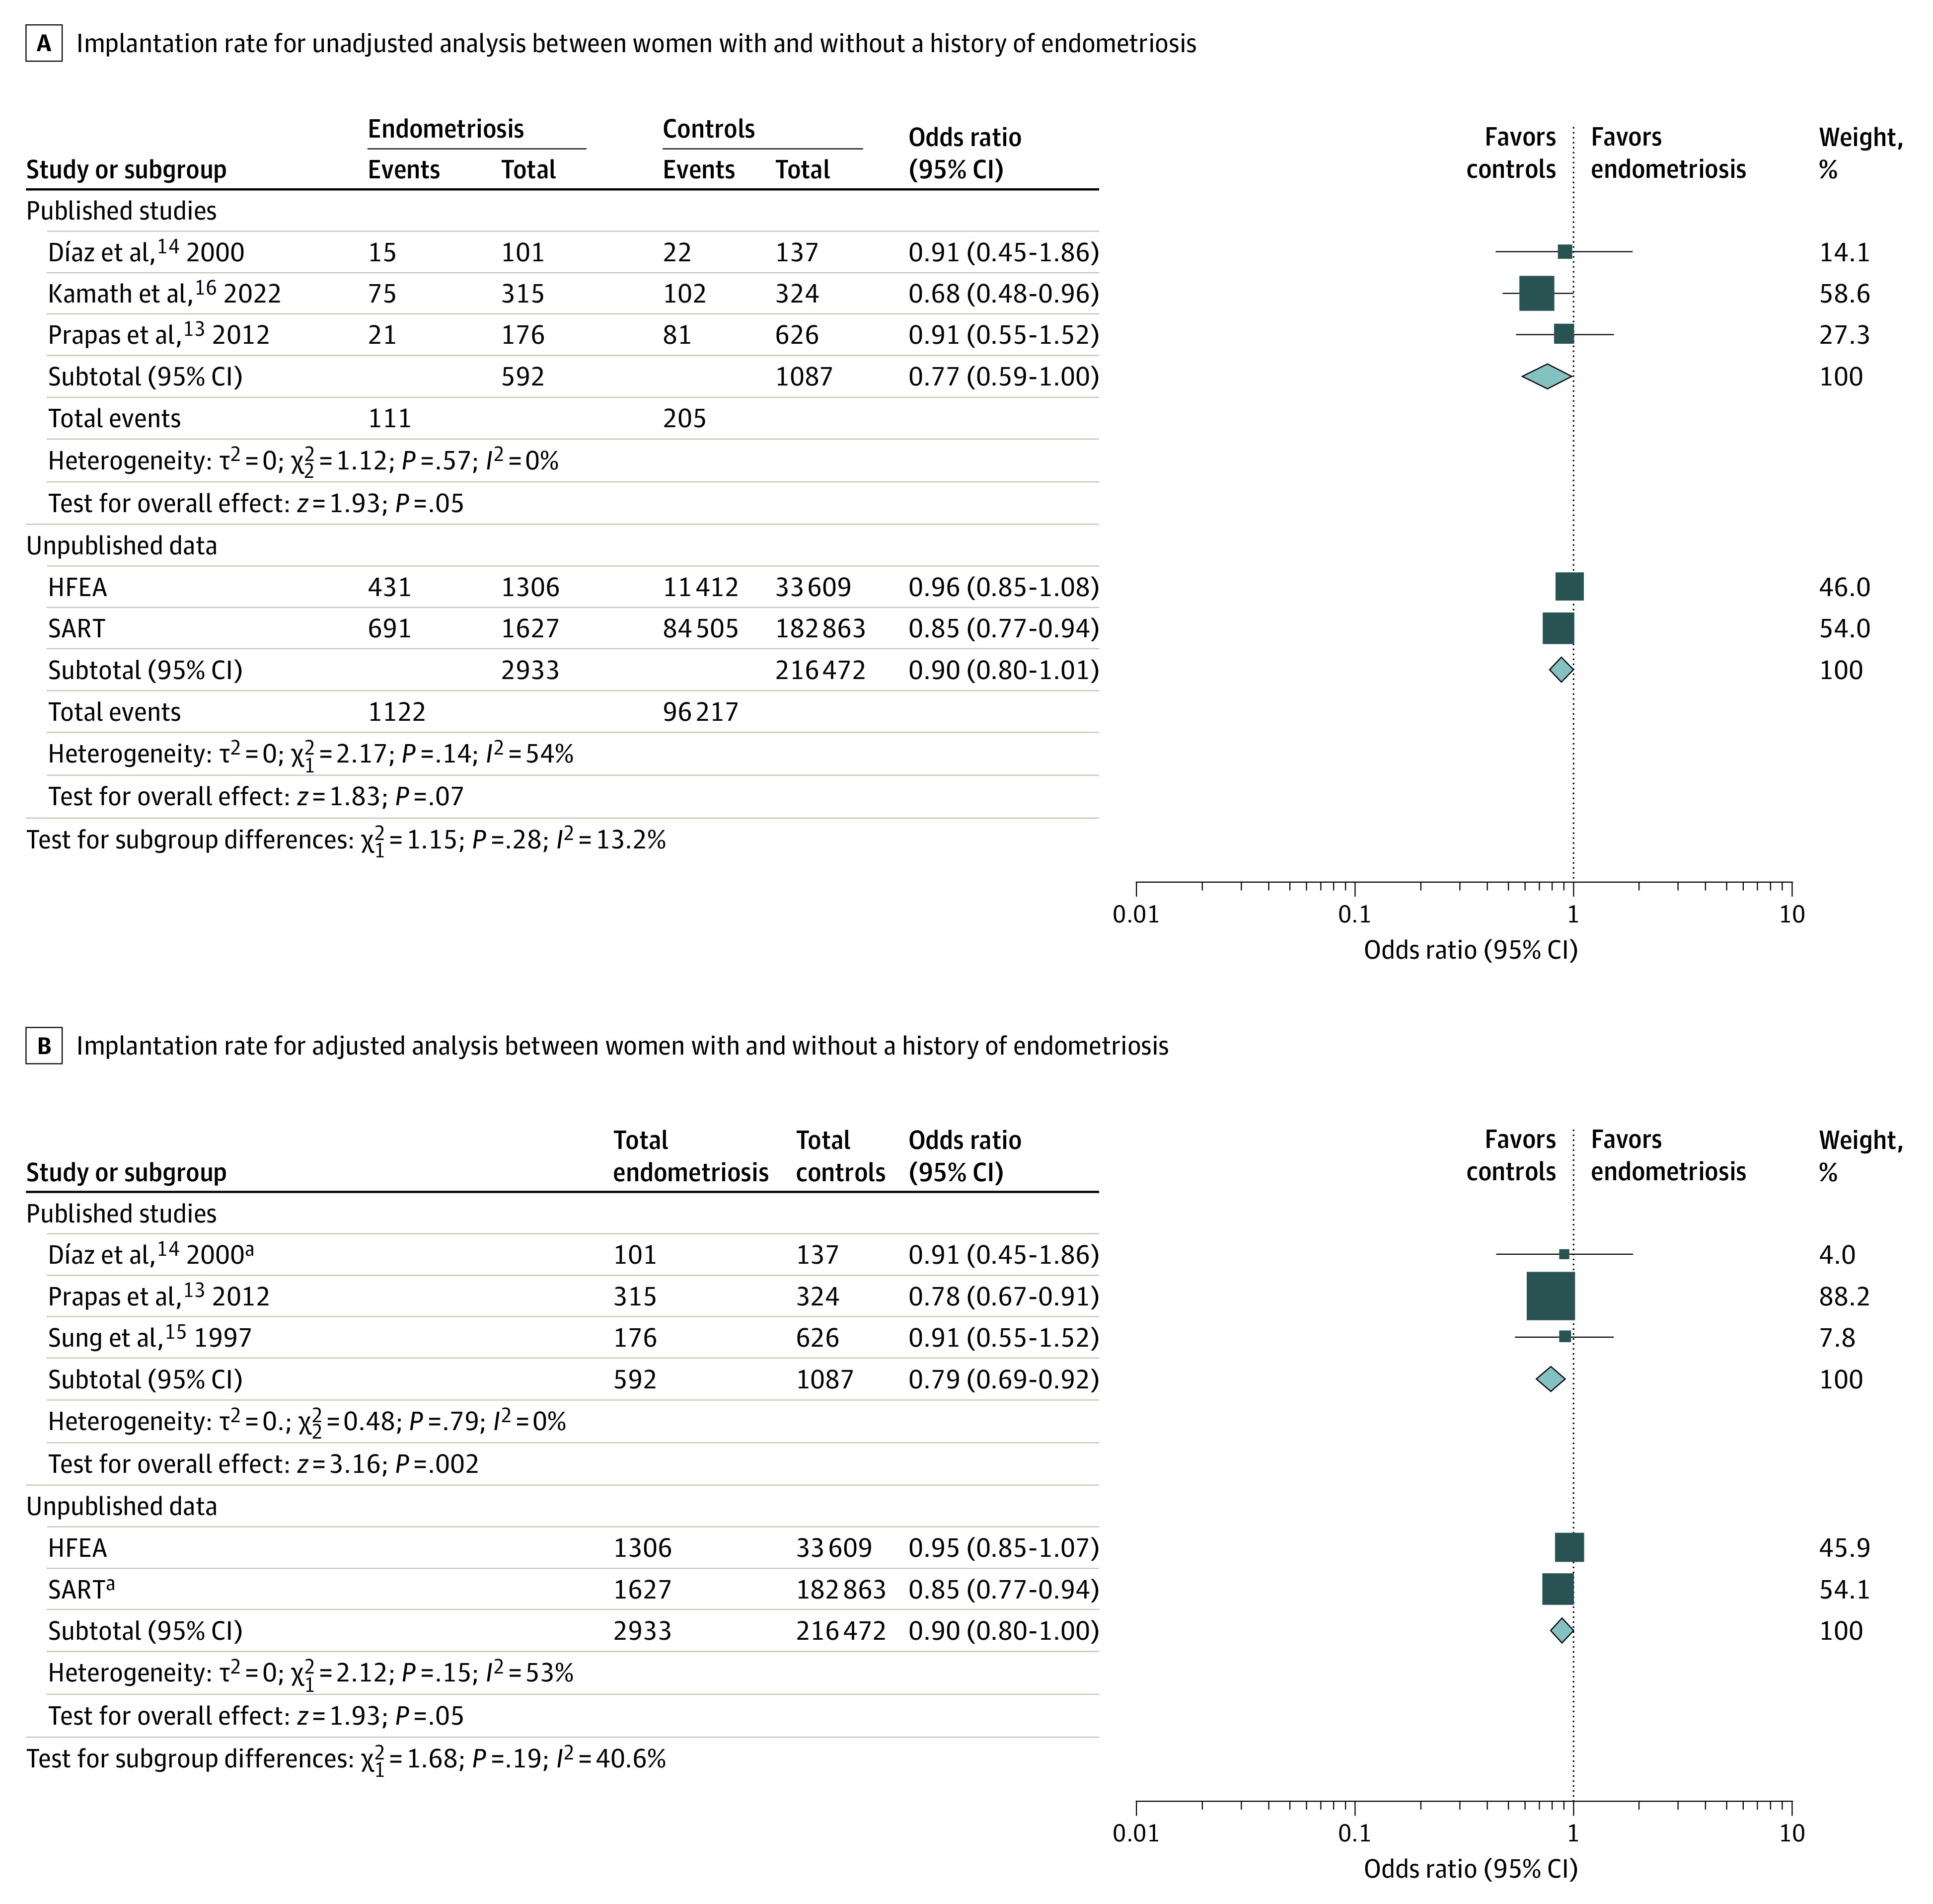
Figure 2. Forest Plots for Implantation Rate for Unadjusted and Adjusted Analysis Between Women With and Without a History of Endometriosis as Recipients of Egg Donation Assisted Reproductive Technology Cycles.

Data from published studies and those from registries (Society for Assisted Reproductive Technology [SART] and Human Fertilization and Embryology Authority [HFEA]) were pooled separately. Squares in panel A refer to dichotomous variables. Squares in panel B indicate the inclusion of log odds ratio and the SE of the log odds ratio in the meta-analysis. Size of the squares depends on the weight assigned to each study in the analysis. Diamonds denote the overall effect estimates; the width of the diamond indicates the 95% CI around the combined effect.
aRefers to unadjusted data or source in which adjustment was not possible.
