
Figure 3.
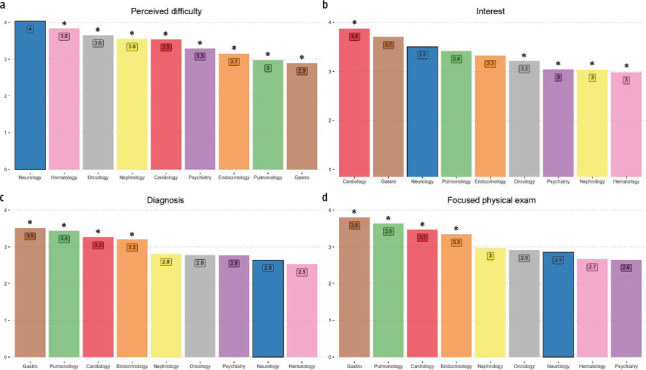
Bar chart of the perception medical interns regarding each medical specialty in terms of interest in the subject (a), perceived difficulty (b), confidence in making a diagnosis (c) and comfort in performing a focused physical exam (d). Mean score of responses on a Likert scale from 1 to 5. A comparison of neurology versus cardiology, endocrinology, gastroenterology (gastro), hematology, nephrology, pulmonology, neurology and psychiatry is provided; identifying with (*) when the p value is <0,05 versus neurology. The p value was calculated using the Mann-Whitney test between each pair of groups with significance correction.