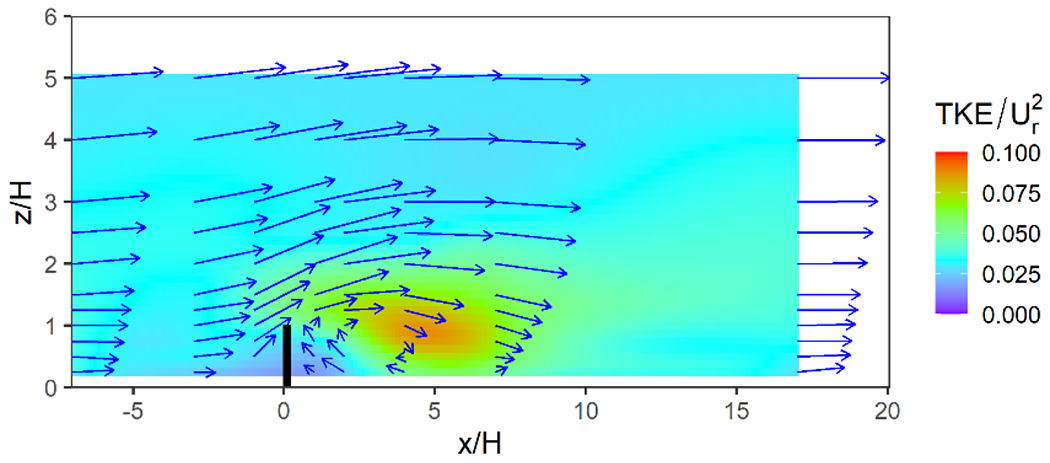
Fig. 2.

Mean velocity vectors (blue arrows) in the x-z plane for a 6 m tall barrier (vertical black bar) located at x/H = 0. Colored contours show the turbulent kinetic energy . LDV data used to construct the figure were measured at x/H = −7, −3, −1,1,2,4,7, and 17
