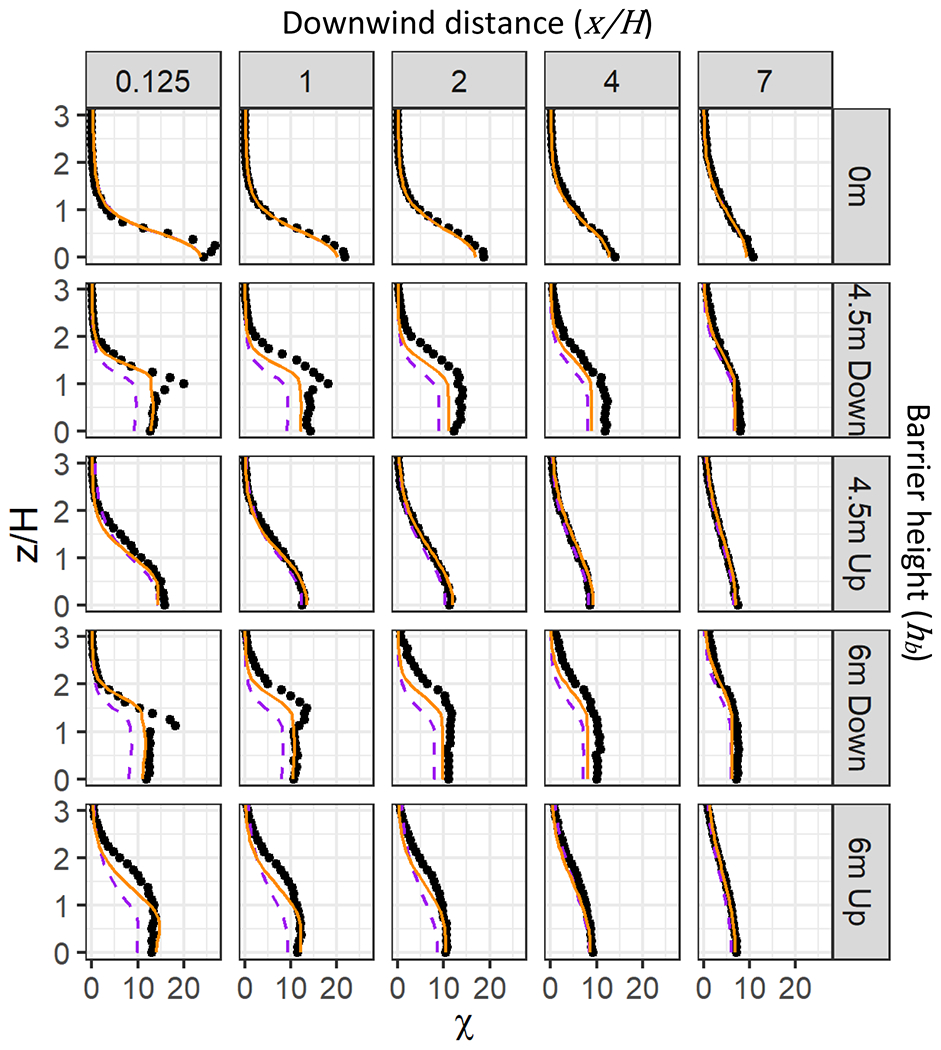
Fig. 7.

Profiles of concentrations (χ) as a function of height (z/H), both normalized. Shown are the No Barrier case (0 m), and Barrier cases with a barrier located at either the upwind edge (Up) or downwind edge (Down) of the roadway and with a barrier height of either 4.5 m or 6 m. Each panel shows a downwind distance from the downwind edge of the roadway (x/H). When present, the downwind barrier is located at x/H = 0 and the upwind barrier is located at x/H = −6. Wind tunnel observations are shown with black dots, AERMOD model results are shown with orange solid lines, and the previous version of the barrier algorithms are shown with purple dashed lines. Note that H = 6 m (length scale)
