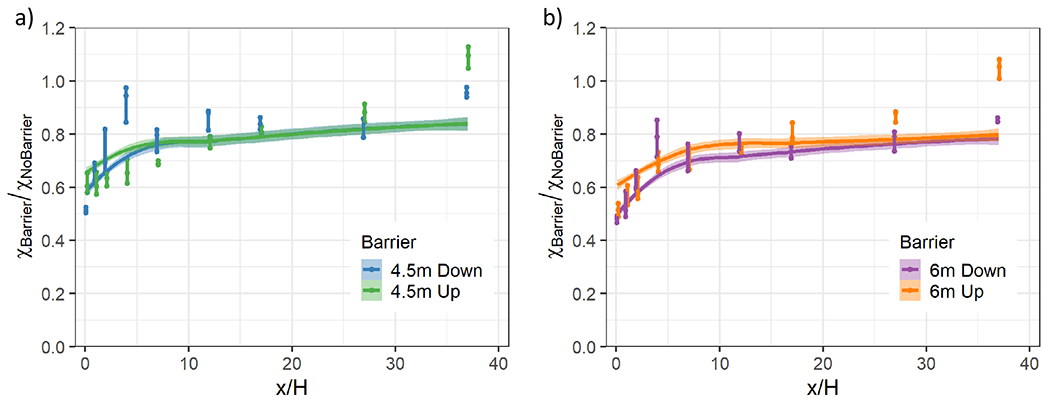
Fig. 9.

Normalized concentration ratios (XBarrier/XNoBarrier) vs. downwind distance from the barrier (x/H) for receptor heights within the breathing level for Barrier cases with the barrier located at either the upwind edge (Up) or downwind edge (Down) of the roadway and with either a 4.5 m or 6 m barrier height. When present, the downwind barrier is located at x/H = 0 and the upwind barrier is located at x/H = −6. Wind tunnel observations (dots) and AERMOD model results (lines with shading indicating the 95% confidence interval) are shown. At each x/H location, the three wind tunnel observations within the breathing level are connected with a vertical line and also slightly displaced along x/H to minimize overlapping other data points
