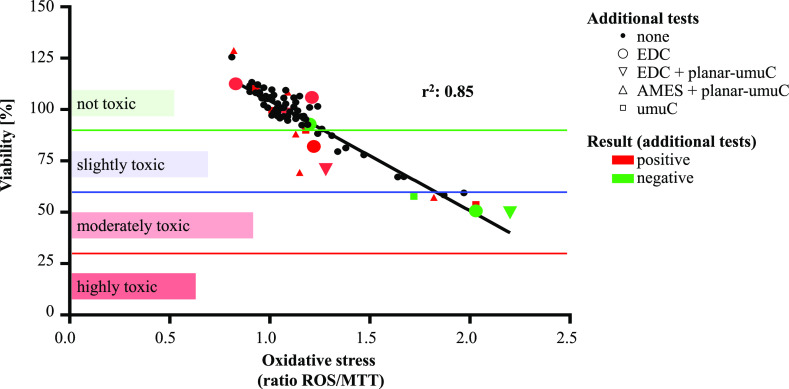
Figure 3.
Biological activities of the tested samples (n = 85). All markers show the results of cytotoxicity (y-axis) against oxidative stress (x-axis) in Huh7 cells after 24 h exposure, with the mean values of three independent experiments shown here. Special markers signify if samples were tested in additional bioassays, and the marker color signifies the result of the additional tests.

