Figure 1.
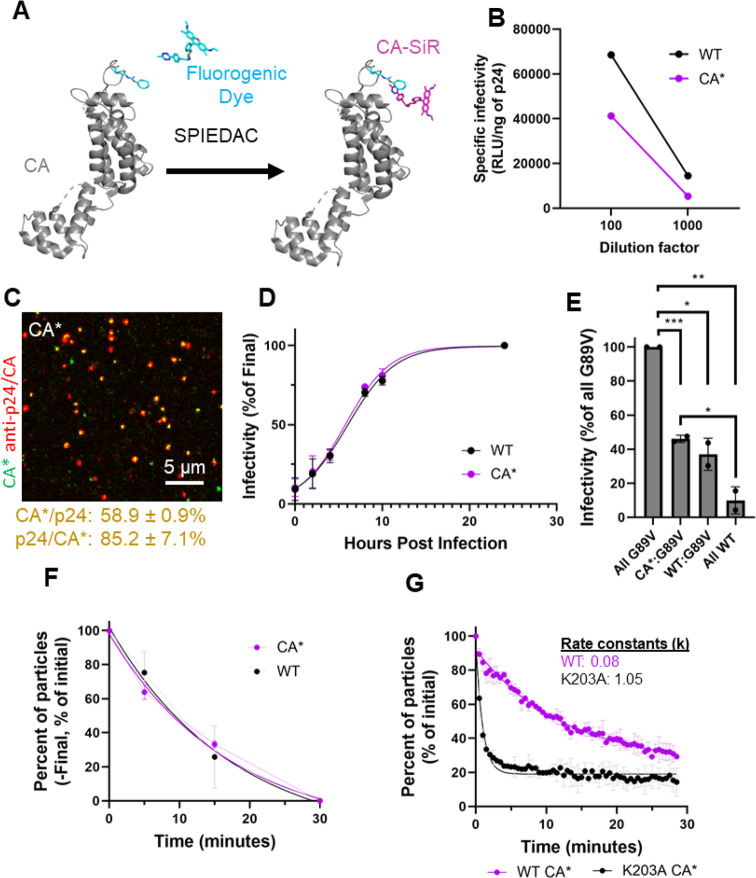
Validation of HIV-1 CA*-labeled pseudoviruses. (A) Schematic illustration of CA protein with the isoleucine-91 site labeled with SiR-tetrazine. PDB models used are 3MGE, 5KAX, 6AAO, and 6NJ4. (B) Representative plots for specific infectivity of control (WT) and SiR-tetrazine labeled CA* pseudoviruses in TZM-bl cells measured as firefly luciferase signal (RLU) and normalized to p24 content. (C) Cell-free CA* pseudovirus plated on poly-l-lysine coated coverglass, labeled with 250 nM SiR-tetrazine and immunostained with mouse anti-p24 AG3.0 antibody and antimouse AF568 second antibody. Colocalization is calculated between three independent preps. Mean and SD are listed. (D) PF74 time-of-addition based measurements of the nuclear import kinetics for SiR-tetrazine-labeled WT and CA* pseudoviruses. Here, 2.5 μM PF74 was added to cells at 0, 2, 4, 8, 10, and 24 hpi (T50 for CA* = 6.27 hpi, T50 for WT CA = 6.58 hpi, mean and SD shown for three different viral preps). T50 values for CAWT and CA* were not statistically different (p = 0.7, unpaired t test). (E) TRIMCyp restriction assay to assess the cyclophilin A binding capabilities of SiR-tetrazine-labeled CA* pseudovirions. TZM-bl cells expressing TRIMCyp were infected with CA*/untagged G89V pseudoviruses, and the resulting luciferase signal was measured after 48 h. Firefly luciferase light units were normalized to p24 ELISA content, and the CA*/untagged G89V ratio was normalized to 100% G89V infectivity (CA*:G89V: p = 0.0008, CAWT:G89V: p = 0.01, CA*:CAWT: p = 0.32, CAWT:G89V: p = 0.003, unpaired t test, mean and SD shown for two different viral preparations). (F) Kinetics core uncoating measured in vitro. CA* and WT pseudoviruses were lysed with 100 μg/mL saponin and fixed/immunostained with anti-CA (AG3.0) antibody. Data are from two independent preps, mean and SD plotted. (G) Kinetics of in vitro uncoating of HIV-1 pseudoviruses containing WT CA*/untagged WT CA and K203A CA*/untagged K203A. A fraction of particles retaining above-threshold CA* signals are responsible for a nonzero plateau. Rate constants (k) for WT and K203A CA* pseudoviruses are 0.08 and 1.05, respectively. Data are from two independent viral preps, mean and SD are plotted. Immature cores were excluded from analysis.

