Figure 3.
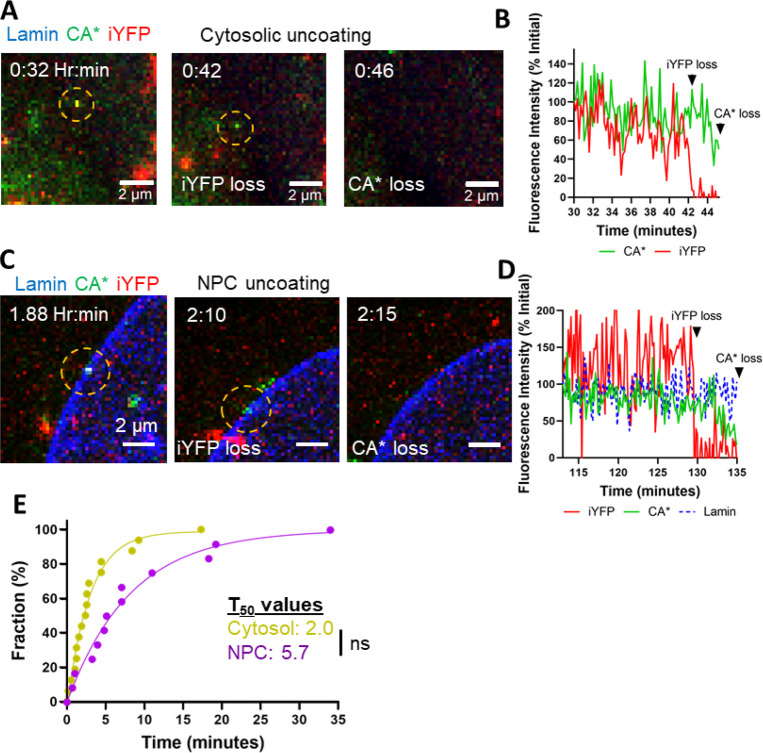
Two-step uncoating exhibited by cytosolic and NPC-localized cores. (A) Live-cell micrograph for a representative two-step cytosolic CA*:Gag-iYFP uncoating event. Yellow dashed circle highlights the core of interest. White text highlights times points for integrity loss and uncoating. Large CA*:Gag-iYFP foci within the cytosol are likely nonfused pseudoviruses trapped in endosomes (refer to Figures 2A,B & S3B,C). Temporal resolution is ∼10 s per frame. (B) Single particle intensity trace of cytosolic uncoating event from panel A. (C) Live-cell micrograph for a representative two-step NPC-localized CA*:Gag-iYFP uncoating event. Yellow dashed circle highlights particle of interest with white text describing uncoating event. Temporal resolution is ∼10 s per frame. (D) Single particle intensity trace of CA*:GagiYFP core from panel C. (E) Two-step uncoating lag-time kinetics for cytosolic, NPC-docked, and nuclear uncoating events. T50 values for each uncoating position are listed beside the graph. Statistical analysis of data was performed with Mann–Whitney rank sum test, p = 0.07.

