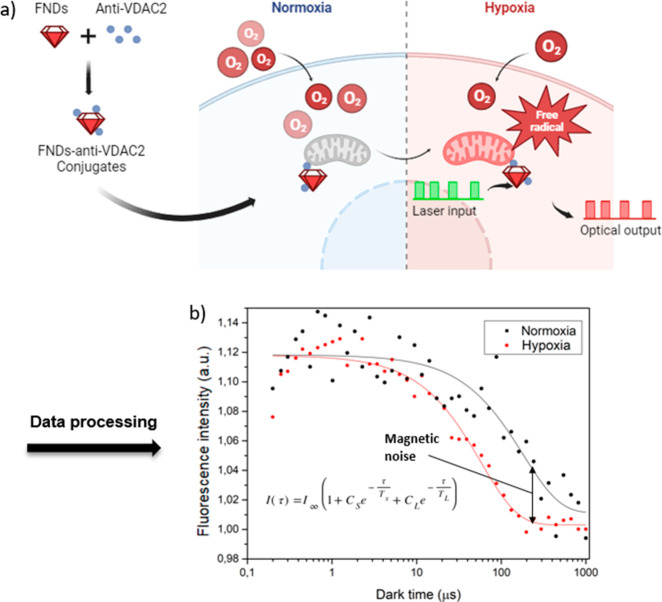
Figure 1.
Schematic representation of the experiments in this article. Nanodiamonds are targeted to mitochondria and sense surrounding free radical generation in heart muscle cells (H9c2 myoblasts). (a) The green blocks (561 nm) represent laser pulses, while the red blocks show the photoluminescence (PL) from the NV centers. The signal detected during these pulses is used to create the T1 relaxation curve. (b) To this end, different dark times are plotted against the PL intensity at the respective dark times to generate a T1 curve. The time to reach equilibrium (T1) is reduced in the presence of free radicals. The red and black lines show T1 measured at normoxia and hypoxia with nanodiamonds targeted to the mitochondria. To ensure accuracy, each pulsing sequence was performed 10,000 times, ensuring a good signal-to-noise ratio.

