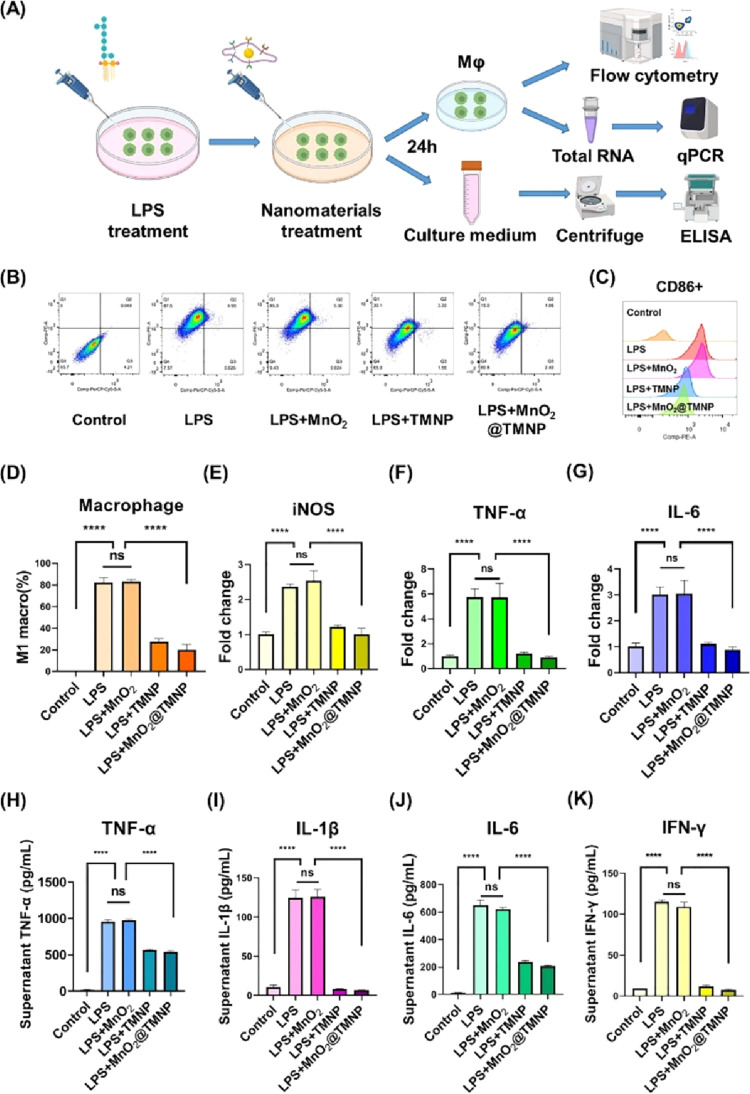
Figure 5.
MnO2@TMNP inhibits the LPS-induced M1 polarization of macrophages. (A) Schematic diagram of the experimental design. (B) Flow cytometry detecting F4/80+CD86+ cells and F4/80+CD206+ cells to evaluate the polarization of macrophages. (C) Quantification of the CD86 geomean fluorescence intensity of macrophages according to flow cytometry. (D) Quantification of the proportion of M1 macrophages in each group. The levels of mRNA encoding iNOS (E), TNF-α (F), and IL-6 (G) in macrophages treated with LPS, LPS+MnO2, LPS+TMNP, or LPS+MnO2@TMNP, respectively. The fold change was normalized to the control group. The concentrations of TNF-α (H), IL-1β (I), IL-6 (J), and IFN-γ (K) in the supernatant after treating macrophages with LPS, LPS+MnO2, LPS+TMNP, or LPS+MnO2@TMNP. Data are presented as the mean ± SD (n = 3): ns, not significant; ****, p < 0.0001 between groups.

