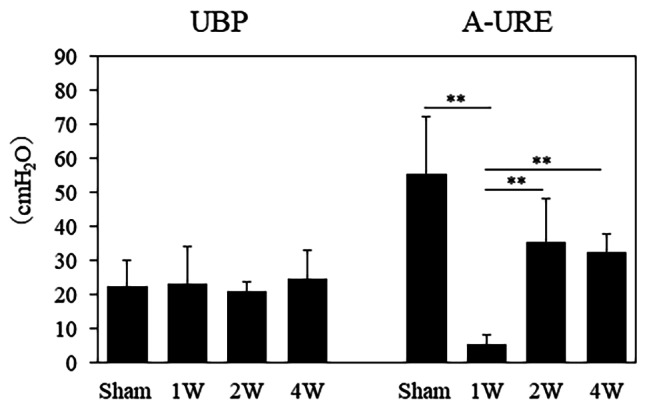
Fig. 1.

There were no significant differences in UBP among the sham, 1 W, 2 W, and 4 W groups. The A-URE values were significantly lower in the 1 W, 2 W, and 4 W groups versus the sham group (all p < 0.01). UBP, urethral baseline pressure; A-URE, amplitude of the urethral response to electrical stimulation; sham group, sham-operated group; 1 W group, 1 week after vaginal distention; 2 W group, 2 weeks after vaginal distention; 4 W group, 4 weeks after vaginal distention. Values are mean ± standard deviation. Statistical analysis ANOVA, Games-Howell test. **Indicates a statistically significant difference (p < 0.01)
