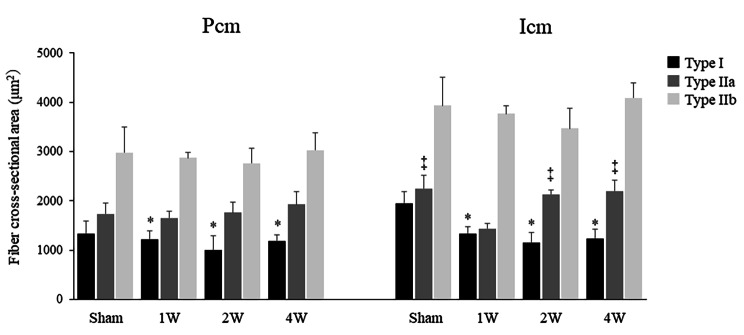
Fig. 3.
The CSA of Type I Pcm fibers was significantly lower in the 1 W, 2 W, and 4 W groups versus the sham group. The CSA of Type IIa and IIb fibers in the Pcm did not differ significantly between the four groups. The CSA of Type I fibers in the Icm fibers was significantly lower in the 1 W, 2 W, and 4 W groups versus the sham group. The CSA of Type IIa fibers in the Icm was significantly lower in the 1 W group versus the sham, 2 W, and 4 W groups (all p < 0.01). The CSA of Type IIb fibers in the Icm did not differ significantly among the four groups. CSA, cross-sectional area; Pcm, pubococcygeus muscle; Icm, iliococcygeus muscle; sham group, sham-operated group; 1 W group, 1 week after vaginal distention; 2 W group, 2 weeks after vaginal distention; 4 W group, 4 weeks after vaginal distention. Values are mean ± standard deviation. Statistical analysis ANOVA, Welch’s t-test and Steel–Dwass multiple comparison test. *Indicates a statistically significant difference (p < 0.05 versus the sham group); ‡Indicates a statistically significant difference (p < 0.01 versus the 1 W group)

