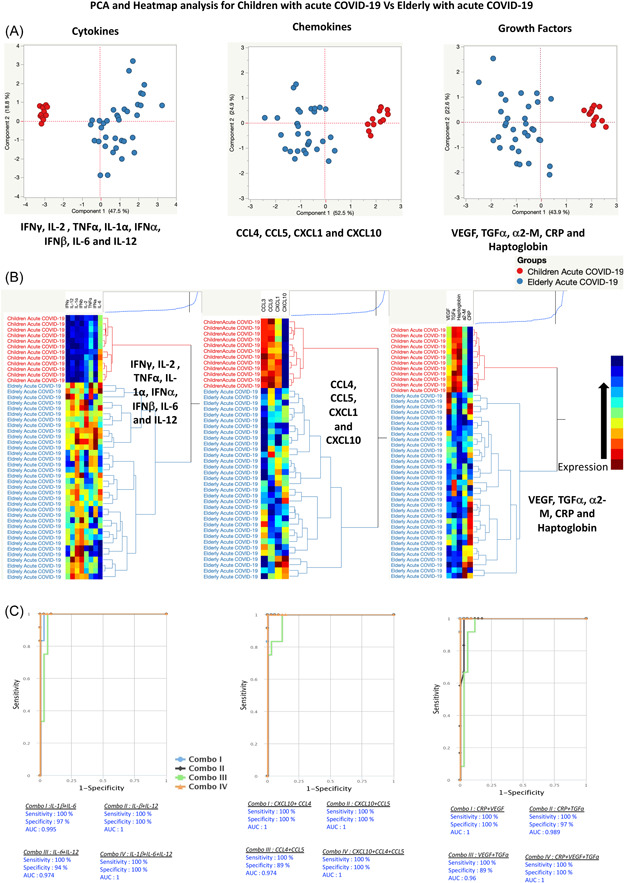
Figure 5.

Plasma cytokines, chemokines, growth factors, and acute‐phase protein markers are different between children and elderly acute COVID‐19 individuals. (A) Principal component analysis (PCA) plot computing normalized cytokines levels after excluding those factors with commonalities as low as 0.5 we used levels of (i) cytokines parameters like interferon (IFN)γ, interleukin (IL)‐2, tumor necrosis factor (TNF)α, IL‐1α, IFNα, IFNβ, IL‐6, and IL‐12 with a combination of two different experimental groups children with acute (colored in red) versus elderly with acute COVID‐19 (colored in blue). The PCA shows the two principal components of variation for cytokines, accounting for 18.8% (x‐axis) and 47.5% (y‐axis). (ii) Normalized chemokines levels after excluding the factors with commonalities as low as 0.5, we used levels of chemokines of CCL4, CCL5, CXCL1, and CXCL10 with a combination of two different experimental groups of children with acute (colored in red) versus elderly with acute COVID‐19 (colored in blue). The PCA shows the two principal components of variation of chemokines, accounting for 24.9% (x‐axis) and 52.5% (y‐axis). (iii) Normalized growth factors and acute‐phase proteins levels after excluding the factors with commonalities as low as 0.5 we used levels of growth factors and acute‐phase proteins of VEGF, transforming growth factorα, α‐2‐M, C‐reactive protein (CRP), and haptoglobin with a combination of two different experimental groups children with acute COVID‐19 (colored in red) versus elderly with acute COVID‐19 (colored in blue). The PCA shows the two principal components of variation, accounting for 22.6% (x‐axis) and 43.9% (y‐axis). (B) (i) Cytokines, (ii) chemokines, (iii) growth factors, and acute‐phase proteins are illustrated according to the score denoted in the color‐scale bar. Associated horizontal dendrograms denote the patient's clustering, standing out clusters containing children with acute COVID‐19 (colored in red) and the elderly with acute COVID‐19 (colored in blue). On the color scale, blue color indicates higher expression and brown color indicates lower expression. (C) A plasma signature of two or three cytokines, chemokines, growth factors, and acute‐phase proteins is a precise biomarker discriminating children with acute COVID‐19 from the elderly with acute COVID‐19. CombiROC model analysis shows the cytokines that exhibited the highest accuracy in discriminating children with acute COVID‐19 from the elderly with acute COVID‐19. ROC curves for comparing multiple markers and their combinations between (i) cytokines, (ii) chemokines, (iii) growth factors, and acute‐phase proteins. ROC, receiver operating characteristic; VEGF, vascular endothelial growth factor.
