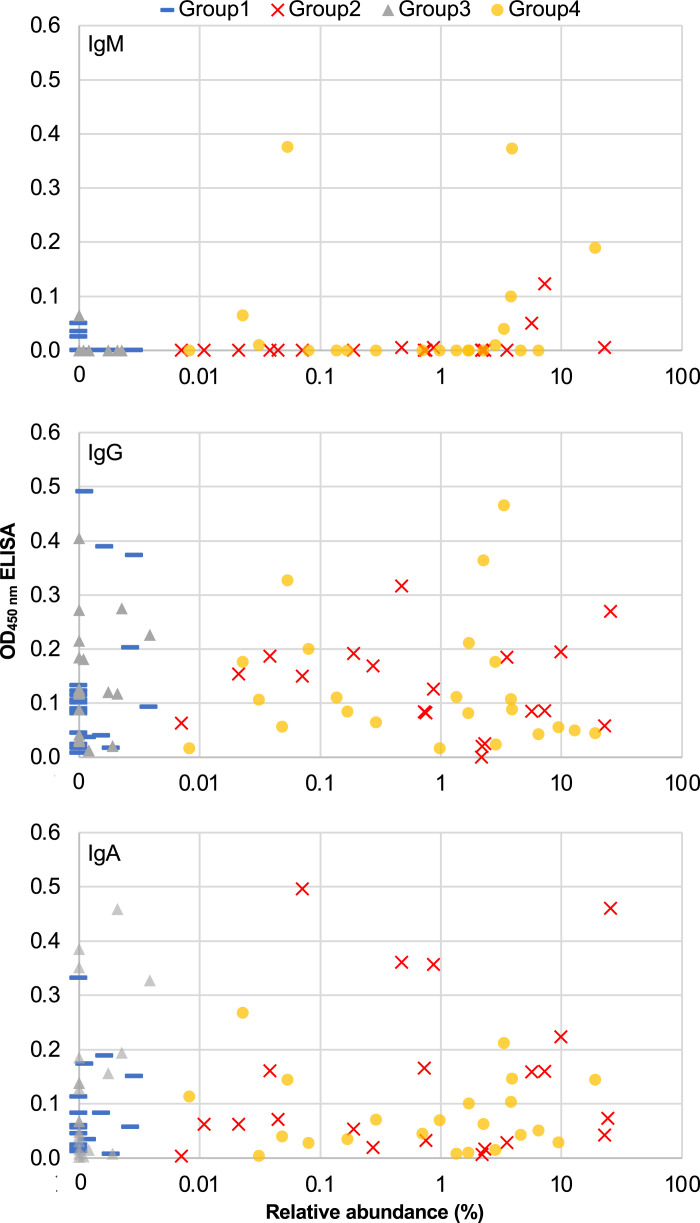
FIGURE 1.
Relative abundance of S. vaginalis versus ELISA values. Scatterplots of relative abundance determined by 16S rRNA survey for each of the swab samples (x-axis in log10 scale) relative to the average of two OD450nm values obtained by isotype-specific ELISA (y-axis). Distinct markers were used for group 1 (preterm birth [PTB], low S. vaginalis), group 2 (PTB, high S. vaginalis), group 3 (term birth [TB], low S. vaginalis), and group 4 (TB, high S. vaginalis).

